Regrid logo, registered trademark
  • Enterprise

    Regrid premium parcel data menu icon Premium Parcels

    • US Parcel Data U.S. Parcels
    • Canada Parcel Data Canadian Parcels
    • global-icon Global Parcels

    Spatial add-ons menu icon Spatial Add-Ons

    • Matched building footprints menu icon Matched Building Footprints
    • Matched secondary addresses menu icon Matched Secondary Addresses
    • Standardized zoning menu icon Standardized Zoning
    • Enhanced property ownership menu icon Daily Ownership Updates

    road icon Roadway ROW

    • Roadway polygons icon U.S. Roadway Polygons

    Data access icon Data Access

    • data-store-2 Coverage Map
    • blog_resources_icon-1 Parcel Schema
    • Bulk files icon Bulk Files
    • Feature Service Feature Service
    • api-icon_2025 Parcel API & Tiles
    • API Sandbox icon Interactive API Sandbox
  • Data Store
  • Regrid App
  • Esri Users
  • Resources

    Support menu icon Support

    • Support site menu icon Support Site
    • Tutorial videos menu icon Tutorial Videos

    Content menu icon Content

    • Blog menu icon Blog
    • Customer stories menu icon Customer Stories
    • Reports menu icon Reports

    Programs menu icon Programs

    • academia_menu-icon Nonprofit & Academia
    • Regrid giving menu icon Regrid Giving
  • Contact Us
Contact Us
  • Enterprise

    Premium Parcels

    • U.S. Parcels
    • Canadian Parcels
    • Global Parcels

    Roadway ROW

    • U.S. Roadway Polygons

    Spatial Add-Ons

    • Matched Building Footprints
    • Matched Secondary Addresses
    • Standardized Zoning
    • Daily Ownership Updates

    Data Access

    • Coverage Map
    • Parcel Schema
    • Bulk Files
    • Feature Service
    • Parcel API & Tiles
    • Interactive API Sandbox
  • Data Store
  • Regrid App
  • Esri Users
  • Resources

    Support

    • Support Site
    • Tutorial Videos

    Programs

    • Nonprofit & Academia
    • Regrid Giving

    Content

    • Blog
    • Customer Stories
    • Reports
  • Contact Us

Regrid Reports

Check out the official reports on customer property survey and data analyses projects using the Regrid Parcel Data

Regrid Blog

Living In The Map

Categories

  • Reports
  • Use Cases
Property dynamics in Milwaukee

Property Dynamics in Milwaukee

Nick Downer January 19, 2021

Milwaukee Property Data provides insights into the local housing market.


As part of Regrid'ss involvement with LISC Milwaukee, this document from November 2020 is a deep dive on the current state of Milwaukee's housing market (as well as practical recommendations, background, and more).

Download the Report

What is this report about?


Milwaukee, alongside other Midwestern cities, is currently at a critical point in its history.

You’ve probably heard the saying that the three most important factors in real estate are “location, location, location.” What this tells us is that the value of a property is subjective - at the end of the day, a building is worth what someone else will pay for it. However, it is important to understand that this willingness to pay doesn’t occur in a vacuum - in a country obsessed with race and class, it is inevitable that these factors play an outsize part in shaping the market.


The fact that America is highly segregated by race and income is no accident. The federal govern - ment, realtors, and buyers themselves have actively pursued a variety of policies that cumula - tively led to neighborhoods segregated by race and class, most of which was completely legal, and some of which continues to this day.


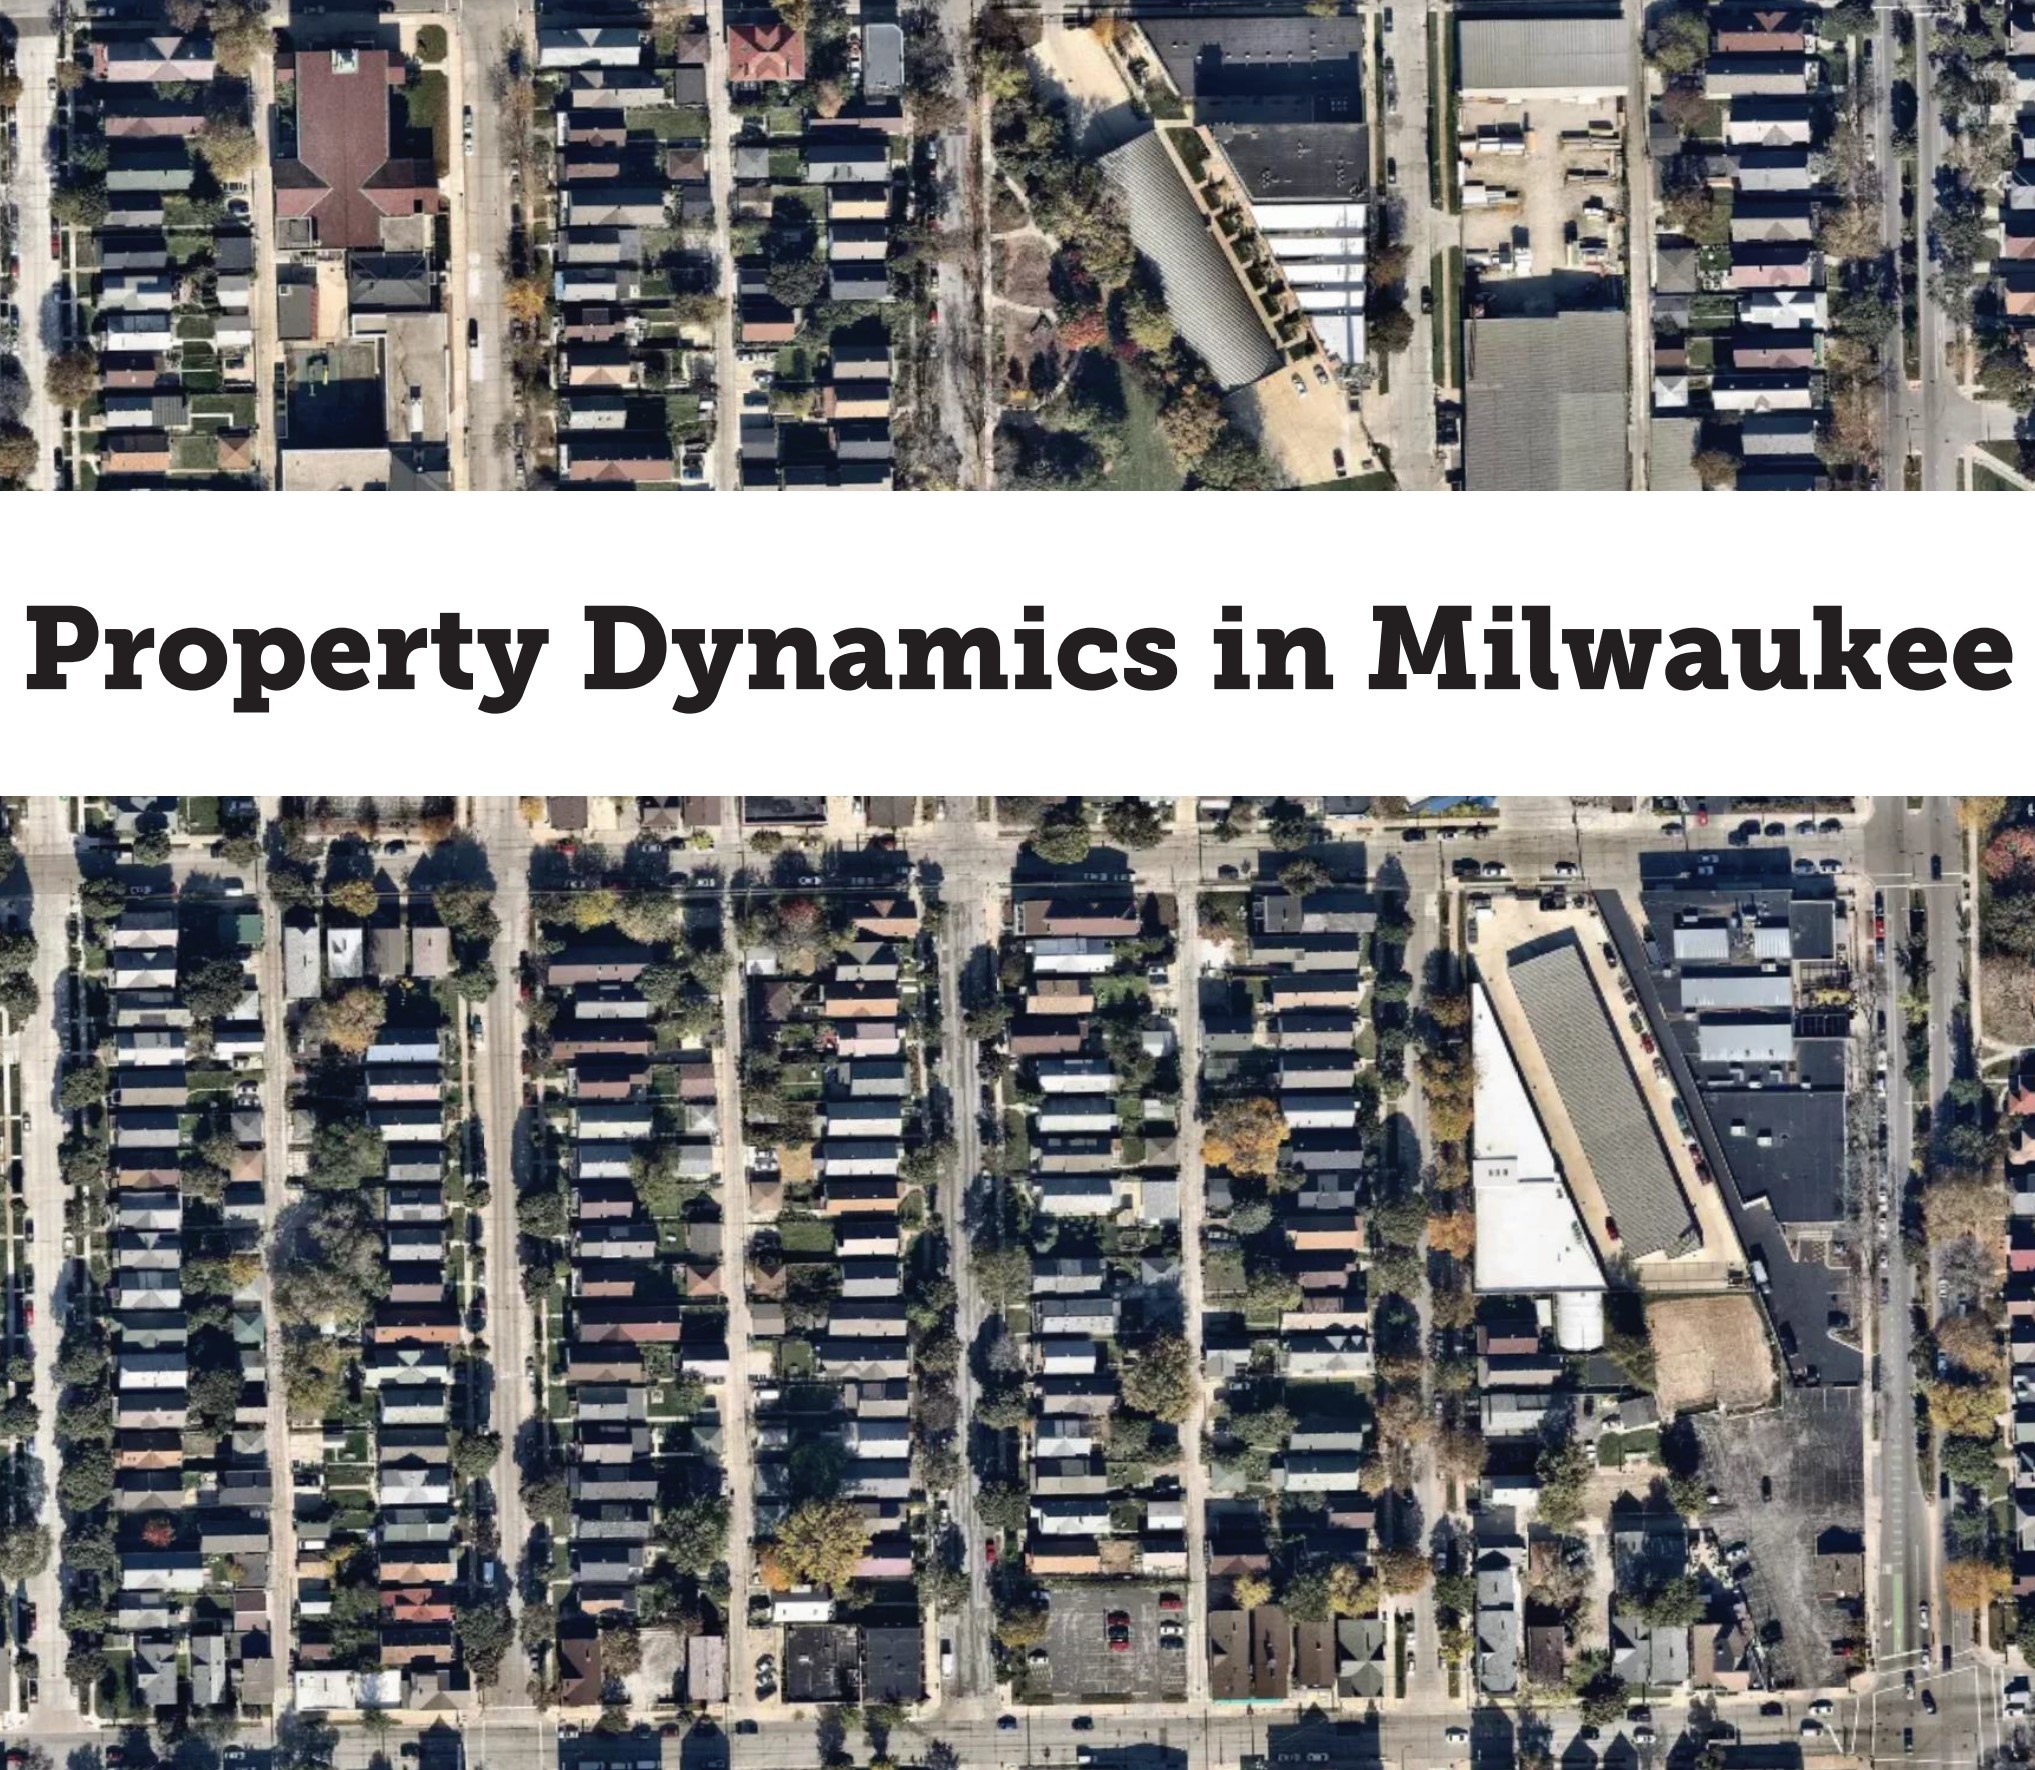
Milwaukee is no exception. Even a brief drive around the city will starkly show that increasing home values and reinvestment are not occurring everywhere equally. There are 'hot' housing markets in some areas, with increasing values, and a decline in housing prices in 'cold' housing markets elsewhere.


Residents in both areas have concerns - loss of value and lack of bank lending/investment in 'cold' areas, and displacement and extremely rapid neighborhood change in 'hot' areas.


The purpose of this report is to use data to look into these invisible forces (the property market and evictions) more deeply, as a starting point. The goal is to show what’s happening in neighborhoods as well as provide a blueprint toward a brighter, more equitable future in whichever neighborhood you call home.

Previous Next
logo

(888) 4RE-GRID

  • Contact Us
  • Customer Support
  • Privacy Policy
  • Terms of Use

Subscribe for email updates

Company

  • About Regrid
  • Careers
  • Press

Resources

  • Coverage Map
  • Support Center
  • Reports
  • Regrid Status Page

Enterprise Solutions

  • U.S. Parcels
  • Canada Parcels
  • Parcel & Tiles API

Self-Serve Solutions

  • Regrid Property App
  • Shop the Data Store
  • API Monthly Plans