×
See Regrid's NEW Roadway ROW Data in Action!
Regrid logo, registered trademark
  • Enterprise

    Regrid premium parcel data menu icon Premium Parcels

    • US Parcel Data U.S. Parcels
    • Canada Parcel Data Canadian Parcels
    • global-icon Global Parcels

    Spatial add-ons menu icon Spatial Add-Ons

    • Matched building footprints menu icon Matched Building Footprints
    • Matched secondary addresses menu icon Matched Secondary Addresses
    • Standardized zoning menu icon Standardized Zoning
    • Enhanced property ownership menu icon Daily Ownership Updates

    road icon Roadway ROW

    • Roadway polygons icon U.S. Roadway Polygons

    Data access icon Data Access

    • data-store-2 Coverage Map
    • blog_resources_icon-1 Parcel Schema
    • Bulk files icon Bulk Files
    • Feature Service Feature Service
    • api-icon_2025 Parcel API & Tiles
    • API Sandbox icon Interactive API Sandbox
  • Data Store
  • Regrid App
  • Esri Users
  • Resources

    Support menu icon Support

    • Support site menu icon Support Site
    • Tutorial videos menu icon Tutorial Videos

    Content menu icon Content

    • Blog menu icon Blog
    • Customer stories menu icon Customer Stories
    • Reports menu icon Reports

    Programs menu icon Programs

    • academia_menu-icon Nonprofit & Academia
    • Regrid giving menu icon Regrid Giving
  • Contact Us
Contact Us
  • Enterprise

    Premium Parcels

    • U.S. Parcels
    • Canadian Parcels
    • Global Parcels

    Roadway ROW

    • U.S. Roadway Polygons

    Spatial Add-Ons

    • Matched Building Footprints
    • Matched Secondary Addresses
    • Standardized Zoning
    • Daily Ownership Updates

    Data Access

    • Coverage Map
    • Parcel Schema
    • Bulk Files
    • Feature Service
    • Parcel API & Tiles
    • Interactive API Sandbox
  • Data Store
  • Regrid App
  • Esri Users
  • Resources

    Support

    • Support Site
    • Tutorial Videos

    Programs

    • Nonprofit & Academia
    • Regrid Giving

    Content

    • Blog
    • Customer Stories
    • Reports
  • Contact Us

The Regrid Blog

Discover the Latest in Land Parcels & Spatial Data with the Regrid Team!

Regrid Blog

Living In The Map

Categories

  • Announcements
  • Parcel Data Updates
  • Democratizing Data
  • Regrid Updates
  • Product How-To
  • Use Cases
  • Customer & Guest Blogs
  • All About Parcel Data
  • Working at Regrid
  • Regrid 100
  • Reports

US-Mexico Border Map Project

Sahana Murthy December 10, 2020

And just like that, we are in December! So much has happened this year, one email won’t be sufficient to summarize all of that. 

To help with the summary, we are putting together an end-of-the-year report on our parcel data, which we will share just before the holidays.

That said, this December update is super special because it is purely focused on a special project that the Loveland team worked on and put together recently to wrap up the year.

US-Mexico Border Map Project

Our team here at Loveland has been curious to take a deeper look at land along the US-Mexico border for a while, and this month we decided to make public an interactive map with an accompanying report!

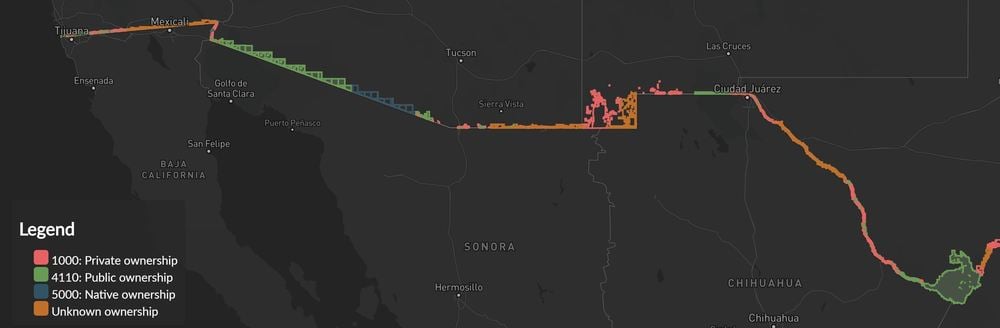
The US-Mexico border is the subject of, shall we say, “vigorous debate” politically - but although much ink has been spilled, our team felt like there has been little said about the current state of the land which lies along its 2,000 miles. This is our attempt to look at the facts on the ground, by applying our parcel data to the task.

A map of land ownership across the US-Mexico border.

The US/Mexico border spans about 2,000 miles, four states and an incredibly diverse array of biomes ranging from major urban areas to swaths of desert. In recent years, the border (and immigration more broadly) has become a political flashpoint. 

Here at Loveland, we realized that our nationwide parcel data was perfect to answer some basic questions that we hadn't heard much about in the media coverage.
Specifically:
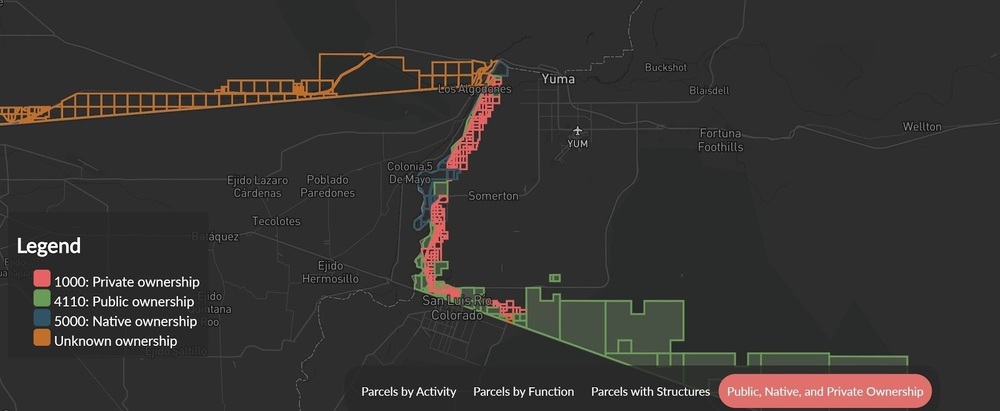
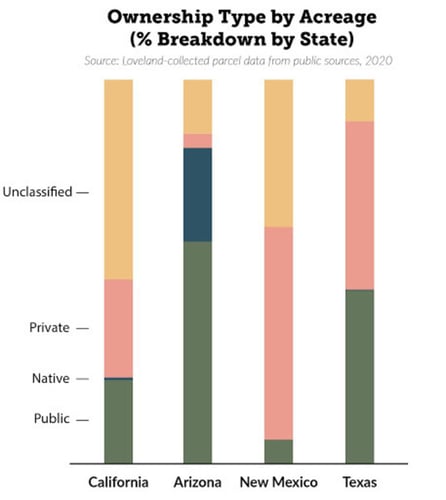
1) Who actually owns border parcels where the wall is being proposed?
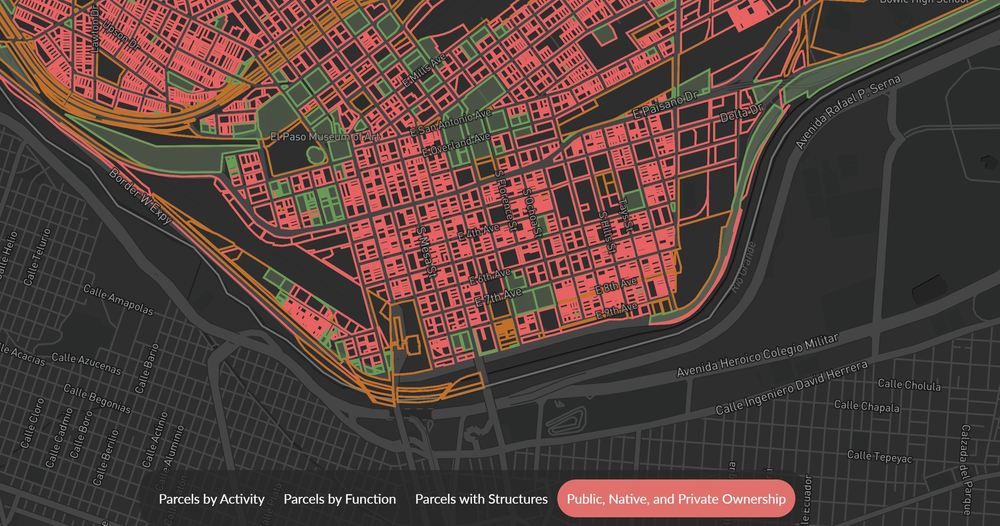
2) What does current land use look like along the border?


Our team dug deeper into the data and the above questions through this project. 

Read the entire report here -

'Report - Border Map' button

A graph of the ownership along the US-Mexico border broken down by Acreage

Along with improving the overall coverage, recency and quality of our parcel data, this year our data team has been working tirelessly in creating nationwide standardized land-use codes using the “Land Based Classification System” LBCS guidelines by APA.

These same codes were applied to the land parcels along the border for a deeper analysis into the significance & ownership of these properties.

This is just one example of the kind of analyses that one can do with data as fundamental as parcel information, coupled with USPS vacancy & nationwide land-use code classification. 

Land ownership on the US-Mexico border, illustrated using the Regrid Mapping Platform.

If this data is of interest to you or if you’d like to build cool interactive maps like the one shown above, please reach out to us at parcels@regrid.com

Also, please don't hesitate to email us if you have any questions/feedback on the border map project. 

That’s the December update for you.

Watch out for our EOY Parcel Data Report -  key improvements & enhancements made to our data through the course of this year!


Happy Mapping!

Team Loveland


Previous Next
logo

(888) 4RE-GRID

  • Contact Us
  • Customer Support
  • Privacy Policy
  • Terms of Use

Subscribe for email updates

Company

  • About Regrid
  • Careers
  • Press

Resources

  • Coverage Map
  • Support Center
  • Reports
  • Regrid Status Page

Enterprise Solutions

  • U.S. Parcels
  • Canada Parcels
  • Parcel & Tiles API

Self-Serve Solutions

  • Regrid Property App
  • Shop the Data Store
  • API Monthly Plans