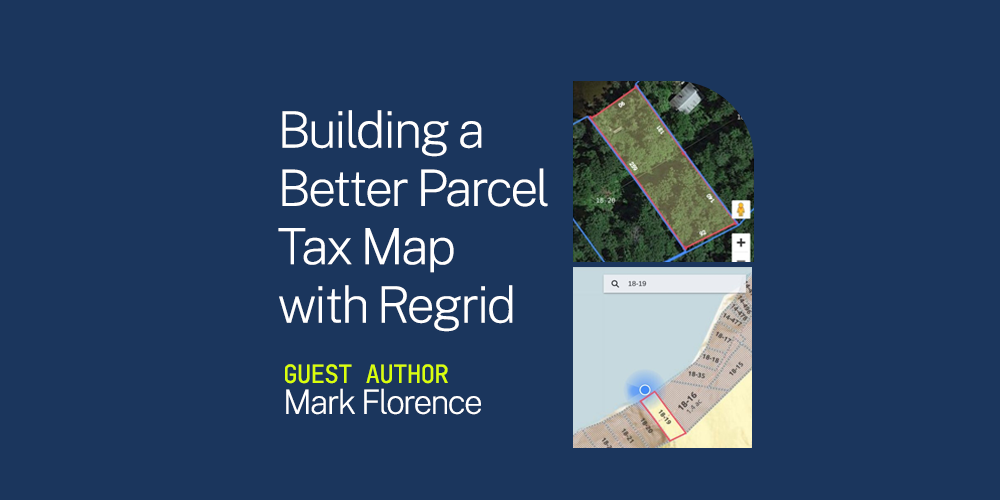
Building a Better Parcel Tax Map with Regrid
Today, the Regrid team turns over the blog post reins to Mark Florence, who recently got in touch with us to share this excellent story about how Regrid's parcel data is being used to underpin local efforts in Washington, NH.
Washington, NH is a small town -- population 1,100 -- with a big heart: 49 square miles of heart to be precise, giving it a slightly larger land area than Boston. The town embraces five scenic lakes, the bulk of Pillsbury State Park, and approximately 2,000 private lots.
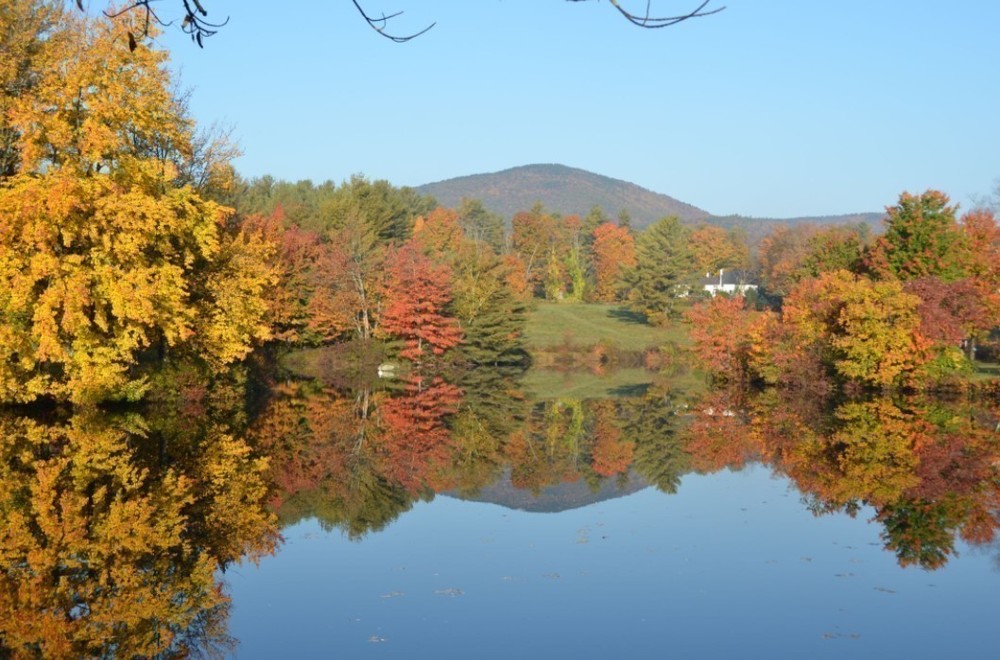 East Washington Pond & Lovewell Mt (w/ kind permission of Washington resident Lynn Hendrickson)
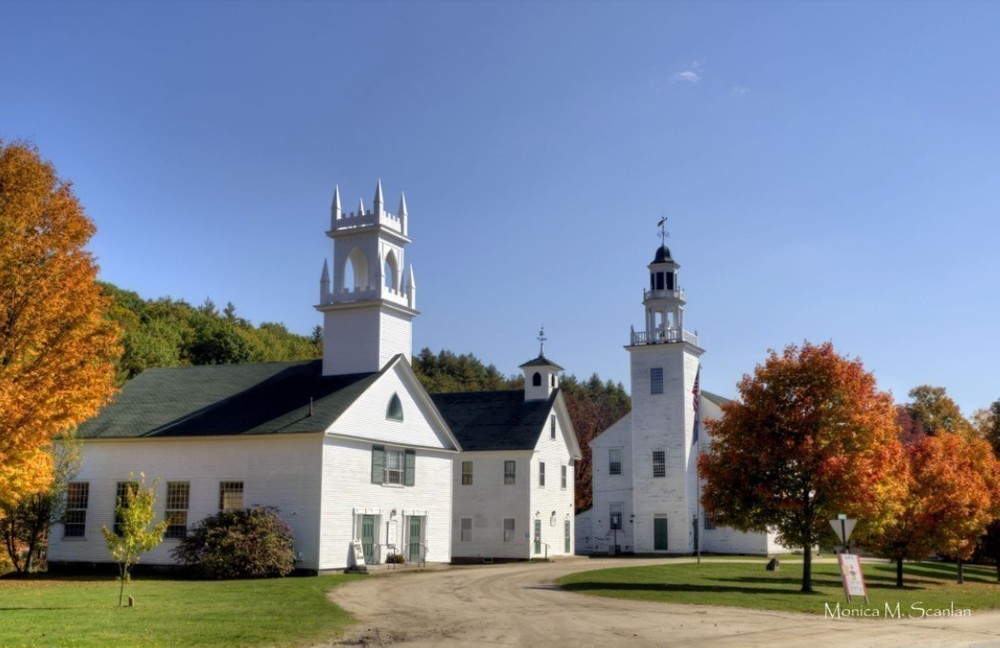
Downtown (w/ kind permission of Washington resident Monica Scanlan)
Most small towns across the country must contract with third parties to produce their tax maps, maps that are often unwieldy, inflexible, and hard-to-use. We’ve been lucky enough to have considerable software development experience in town and an excellent data partner in Regrid. We leveraged that combination to build a compelling set of color-coded wall maps and a fully interactive app to explore them at lots.washingtonnh.online.
This is our story: what we started with, the app we built, the people who use it -- from the Selectmen to the Planning Board to homeowners and prospective developers -- and how Regrid helped us get there.
About the Author

My name is Mark Florence. I am currently a member of the Washington Zoning Board of Adjustment (ZBA). I'll talk more about the role of the ZBA later, as it gave me a unique perspective on the mapping and data needs of our town.
I’ve been developing software, both front-end and back-end, for longer than I care to admit, most recently as Chief Scientist for Appcast in Lebanon, NH. Now I can spend my time exclusively on my open-source projects and on my work with the town and the ZBA.
How We Found Regrid
Once we decided we needed a better way to map our town, it was easy to find Regrid through its excellent SEO web presence.
Two features clinched the deal besides the many success stories we read: latitude and longitude coordinates and rich metadata. We knew that with simple trig, we could use the coordinates Regrid supplies for every parcel to overlay lot boundaries over other open-source maps, such as those from OpenStreetMap. With the additional metadata of land use categorization and acreage, we could color-code lots by usage and annotate their size.
We started by analyzing the Regrid Coverage Report to ensure that the data we needed was available for our area. Then we had no trouble purchasing the premium bulk data download for Sullivan County, NH. We subsequently converted the CSV data into JSON and augmented it with data from our assessor’s database to create the heart of our mapping software.
First Steps Toward Better Maps
Classic tax maps are notoriously hard to use. We’ll see why later in a head-to-head comparison, but the takeaway to remember is this: they’re structured to make them easy to prepare, not to make them easy to read.
What is a “classic tax map”? It is a physical sheet of paper covering a geographical area constrained by the size of that sheet. Often, these maps are available online as PDF documents, as are the Washington Tax Maps.
Let’s take a look at my lot for a quick dive into how these maps are built.

Does that mean that all the 9-x lots are on physical map 9? Not likely. In Washington, many 23-x lots appear on map 9 and vice versa. There’s no index, and a map’s extent is arbitrary, not tied to any natural geographical features, so finding a lot is extremely hard, even for professionals like the Assessor or Tax Clerk.
Regrid opens the door to a much better approach. The lots around Freezeland Pond show how.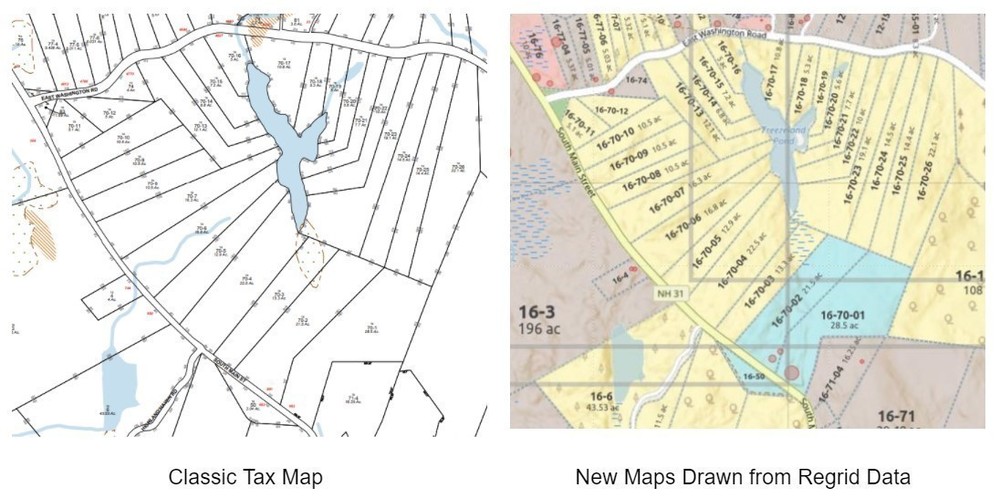
We took some simple steps first. The size of the font used to identify a lot is proportional to its acreage. Unless the plot of land is big enough to write horizontally, its ID and area are drawn parallel to its longest axis. Lots are color-coded according to their use, as guided by Traditional Color Coding for Land Uses (brown for residential, pink for commercial, blue for municipal, and so on.)
Then we overlaid topographic detail (roads, bodies of water, etc.) from OpenStreetMap and hillshade (to highlight terrain) from ArcGIS. The process is applied to every lot to produce a set of maps, starting with a 4’ x 3’ map of the entire town, plus five 3’ x 2’ inserts for the more densely populated areas around our lakes.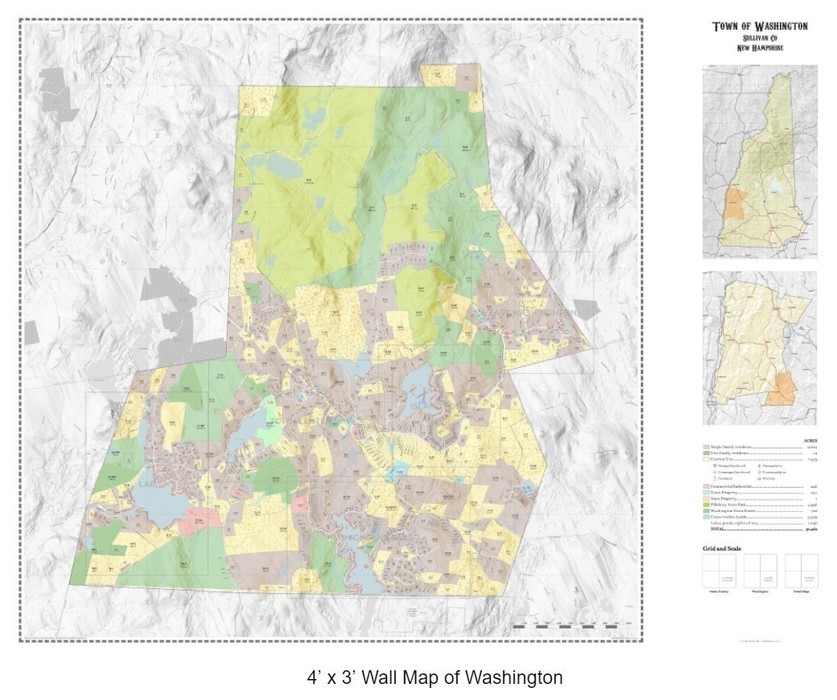
The Next Step: Fully Interactive Maps

User-friendly printed maps are a significant first step, and there’s no doubt that their presence on the wall of the Selectmen's office is a considerable improvement. Still, we knew that we would not meet our goals unless the maps were searchable and the full power of the underlying data exposed.
| Selectmen's Office (w/ the kind permission of Selectman Don Revane) |
Our next step was to use the images that produced the printed maps to feed a fully interactive app. You can launch the app from lots.washingtonnh.online, which we designed from the ground up to work equally well on laptops or mobile devices. We’ll explore its capabilities through the eyes of the teams in Washington that use it.
Selectmen’s Office: Finding the Elusive Lot
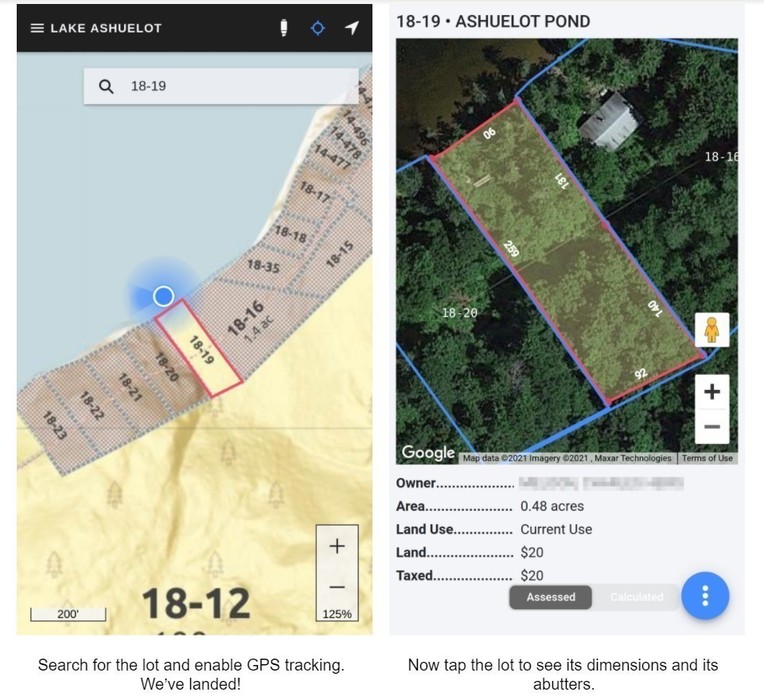
Suppose that the owner of lot 18-19 on the south shore of Lake Ashuelot wishes to develop. Generally, the Selectmen must approve the proposal, and their first step will be to visit the property.
However, this is an area of primitive cabins, few lot line markers, and there’s no driveable road within a half-mile of either direction. Even worse, some landowners won’t grant permission to cross their woods, so the Selectmen must navigate by boat.
How do they know when they’ve reached lot 18-19? No problem with our app loaded on their phones.
Planning Board: What if we Zoned Differently?
Washington has no separate land use zones: all lots are subject to the same regulations, as laid out in our Land Use Ordinance. To develop an empty lot, that lot must be at least 4 acres. All structures must be a minimum of 50’ from the roadway and 30’ from any lot line.
However, many parcels surrounding our lakes, much smaller than the current minimums, were subdivided as early as the 1950s, predating any restrictions. These half- and quarter-acre lots became camps or three-season getaway cabins for families seeking a rural retreat from Boston and neighboring cities.
Nonconforming use is guaranteed in perpetuity by State law, as the town cannot deprive a landowner of their property rights retroactively. But that only applies to a structure’s original footprint. Over the years, homeowners have wished to expand, adding decks, garages, and swimming pools. Each time, they’re required to apply for variances from the Land Use Ordinance to do so, creating a good deal of friction and inconvenience.
So the planning board is always looking at the possibility of creating a separate zone for these grandfathered lots. But which lots are affected? What area will be covered?
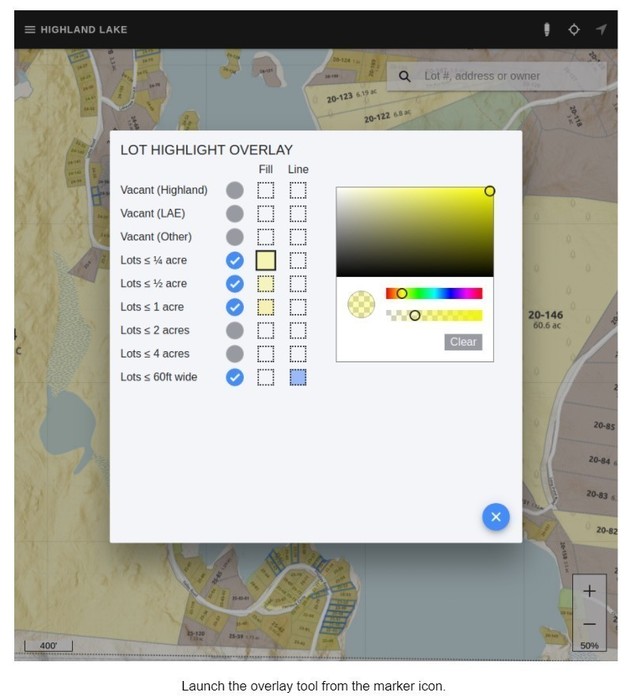
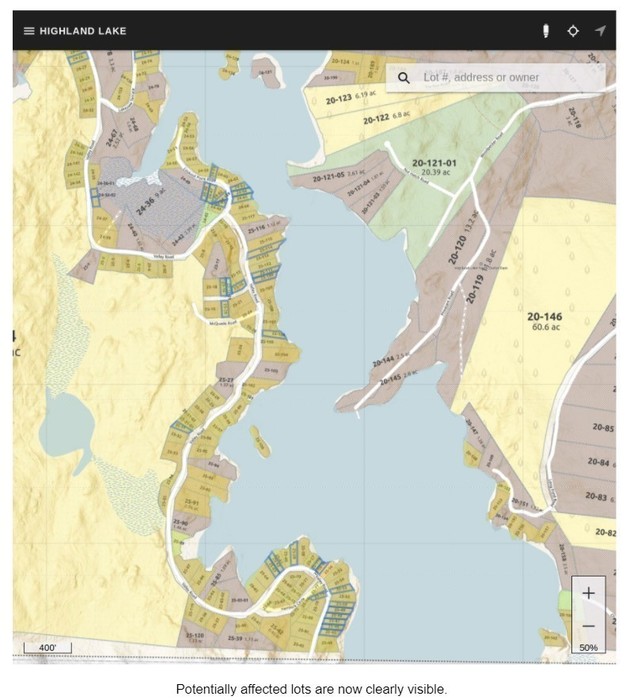
Our interactive app allows any user to create a personal overlay to the maps. Suppose we wish to explore all lots smaller than one acre and less than 60’ wide (at this width, it is impossible to meet the setback requirements.)
Let’s see how that affects the cluster of lots on the west shore of Highland Lake. We can zoom out because we are interested in patterns, not individual lots.
Zoning Board of Adjustment: Who are the Abutters?
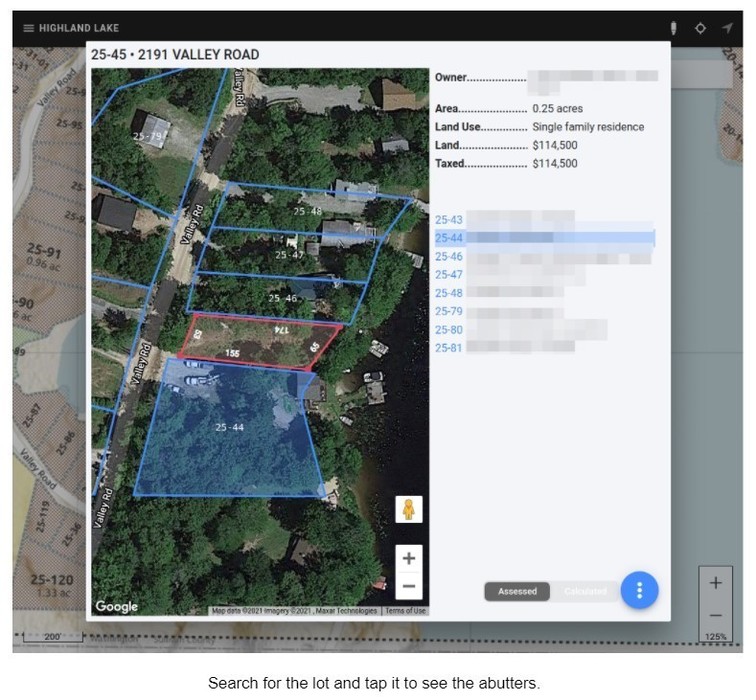
In New Hampshire, the Zoning Board of Adjustment acts as a “relief valve” for property owners. The Planning Board is obligated to deny any proposal that contravenes its local Land Use Ordinance. Owners can then apply to the ZBA for a variance. The ZBA is a semi-judicial body composed solely of town residents. The ZBA adjudicates variance applications at a public hearing, to which abutters and other interested parties must be invited.
Suppose the owner of lot 25-45 wishes to obtain a setback variance. The ZBA can now easily research the lot dimensions, proximity to lot lines, and the affected abutters.
Residents: Where are the Protected Forests?
Washington is right in the middle of a significant wildlife corridor. Bear, moose, deer, beaver, fox, and bobcat are as much at home as are we human residents. More than 25% of our land area is either State Park, Town Forest, or other parcels with a conservation easement that inhibits development. All this is of great interest to hikers, hunters, bird watchers, and photographers.
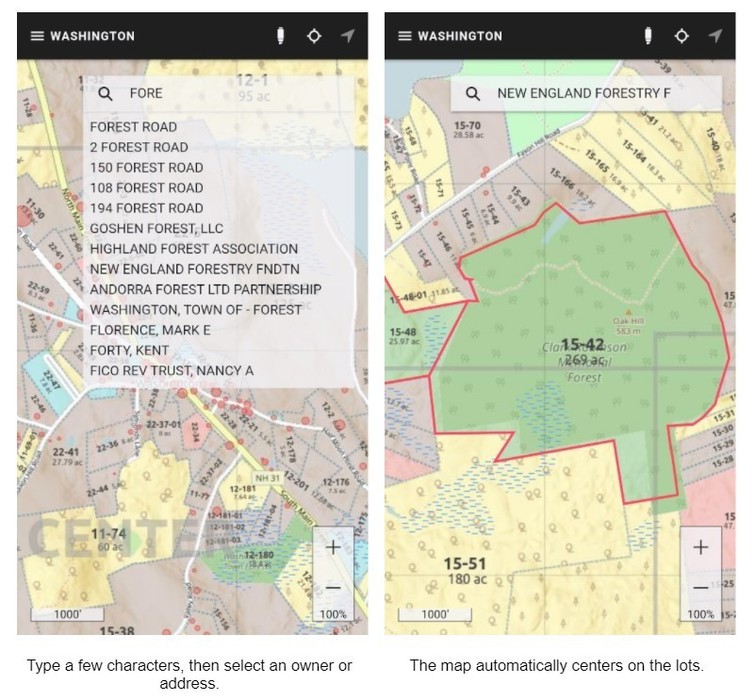
Our app is completely free to download and doesn’t require a login or signup. We link to it from our popular town website and it appears as a front-page result in a Google search for washington nh maps. Even long-time residents have used it to explore hidden corners of Washington’s open spaces and we’ve captured the interest of hikers, photographers and conservationists throughout the area, for example by allowing users to find protected forest lands.
Let’s see where the New England Forestry Foundation is active in Washington:
Conclusion
We’ve seen the impact our maps have had on Washington. From the Selectmen to the Land Use Boards, officials are making better and more expeditious decisions. With maps and metadata at their fingertips, they’re fully equipped to help residents and prospective developers alike. Residents themselves have a new perspective and a greater understanding of the town many have called home for generations.
The future is bright too: an upcoming release will add an overlay of bridges and culverts, helping the Highway Department deliver services where they are needed, and a UI will allow metadata and other revisions to be made right from the Assessor’s or Tax Clerk’s Office.
We hope our story might inspire other towns to similar success. We would love to help and learn on that journey. Please feel free to contact me, Mark Florence, at mflo999@gmail.com or on Twitter at @mflo999. I can connect you to the folks in Washington who use our maps and I’m more than happy to talk about your projects.
About the Tech Stack
All our mapping software is open-source, covered by an MIT license that allows anyone to use it for any purpose, without restriction. Other towns might be interested in using the software to make their own similar maps.
The source code can be found in two GitHub repos: washington-mapmaker produces the map images, and washington-app is the interactive app that uses them. We built both using the Angular and Ionic frameworks. The app is hosted by the AWS Lambda serverless service.
The interactive app is a PWA (Progressive Web App), which means that it can be installed onto the home screen of an iOS or Android device. It operates even when completely off-line. Full details are available by following the app’s Help link to its README page.
Learn more about Regrid Parcel Data.