×
Regrid 100: The First-Ever 100% US Land Parcel Coverage Map
Regrid logo, registered trademark
  • Enterprise Solutions

    Regrid parcel data Regrid Parcel Data

    Bulk files delivered in the format your business needs.

    • parcel -data Nationwide Parcel Data
    • matched building footprints menu icon Matched Building Footprints
    • matched secondary addresses menu icon Matched Secondary Addresses
    • enhanced ownership menu icon Enhanced Ownership

    feature service menu icon Regrid Feature Service

    Get data delivery straight into your Esri-stack, no custom integration required.

    regrid api menu icon Regrid API

    Integrate parcel boundaries & records into your app, SaaS, or map.
    • Parcel and Tiles APIcon Parcel & Tiles API
    • typeahead api icon Typeahead API
  • Self Serve Options

    Regrid Property App menu icon Regrid Property App

    Take Regrid property data wherever you go - available for web, iOS, & Android.

    data-store-2 Shop the Data Store

    Instantly download parcel geometries & associated records, by county and state.

    self-serve parcel api menu icon API Monthly Subscriptions

    Sign up and try this nationwide parcel API, free for 7 days.

    api sandbox icon Interactive API Sandbox

    Explore the API Sandbox with complete feature access to 7 counties plus Puerto Rico.
  • Markets

    Regrid for Broadband Market Broadband

    Regrid for data science Data Science

    Esri environments Esri Users

    Parcel data for green initiatives Sustainable Initiatives

    Parcel data for real estate Real Estate

    Parcel data for nonprofit and academia Nonprofit & Academia

    Regrid's Data With Purpose program - propose your own budget to access land parcel data. 

    Plus sign icon Your Business or Organization

    Regrid’s data spans all industries needing land insight.
  • Resources

    support menu icon Support

    Access documentation & support materials to learn about Regrid data.
    • Support site resource icon Support Site
    • tutorial videos resources icon Tutorial Videos
    • parcel data faqs resources icon Parcel Data FAQs
    • property app faqs Property App FAQs
    • coveragemap_resources_icon Coverage Map
    • land use codes menu item Land Use Codes
    • vacancy data menu icon Vacancy Data

    content resources menu icon Content

    Dive into Regrid's world of land parcels & learn about location intelligence.
    • blog resources icon Blog
    • webcasts resources icon Webcasts
    • reports resources icon Reports
    • podcast resources icon Living In The Map

    customers resources icon Customers

    Hear what our customers say have to say & see how they use Regrid data.
    • testimonials resources icon Testimonials
    • Case Studies resources icon Case Studies
  • Contact Us

    Contact a parcel data expert menu icon Contact A Parcel Data Expert

    Contact Regrid parcel data experts to learn more about our offerings.

    Customer Support menu icon Customer Support

    Contact our customer support team & get the help you need.

    megamenu nav image Press & Media Inquires

    Find the information you need & get in touch with our marketing department.
  • Go To Map
Go To Map
  • Enterprise Solutions

    Regrid Parcel Data

    • Nationwide Parcel Data
    • Matched Building Footprints
    • Matched Secondary Addresses
    • Enhanced Ownership

    Regrid Feature Service

    Regrid API

    • Parcel & Tiles API
    • Typeahead API
  • Self Serve Options

    Regrid Property App

    Shop the Data Store

    API Monthly Subscriptions

    Interactive API Sandbox

  • Markets

    Broadband

    Data Science

    Esri Users

    Sustainable Initiatives

    Real Estate

    Nonprofit & Academia

    Your Business or Organization

  • Resources

    Support

    • Support Site
    • Tutorial Videos
    • Parcel Data FAQs
    • Property App FAQs
    • Coverage Map
    • Land Use Codes
    • Vacancy Data

    Content

    • Blog
    • Webcasts
    • Reports
    • Living In The Map

    Customers

    • Testimonials
    • Case Studies
  • Contact Us

    Contact A Parcel Data Expert

    Customer Support

    Press & Media Inquires

  • Go To Map

The Regrid Blog

Discover the Latest in Land Parcels & Spatial Data with the Regrid Team!

Regrid Blog

Living In The Map

Categories

  • Announcements
  • Democratizing Data
  • Regrid Updates
  • Parcel Data Updates
  • Product How-To
  • Use Cases
  • Customer & Guest Blogs
  • All About Parcel Data
  • Working at Regrid
  • Regrid 100
Rising seas threaten tax bases as private property falls below tidelines, Press Release

Rising seas threaten tax bases - Press Release

Climate Central September 8, 2022

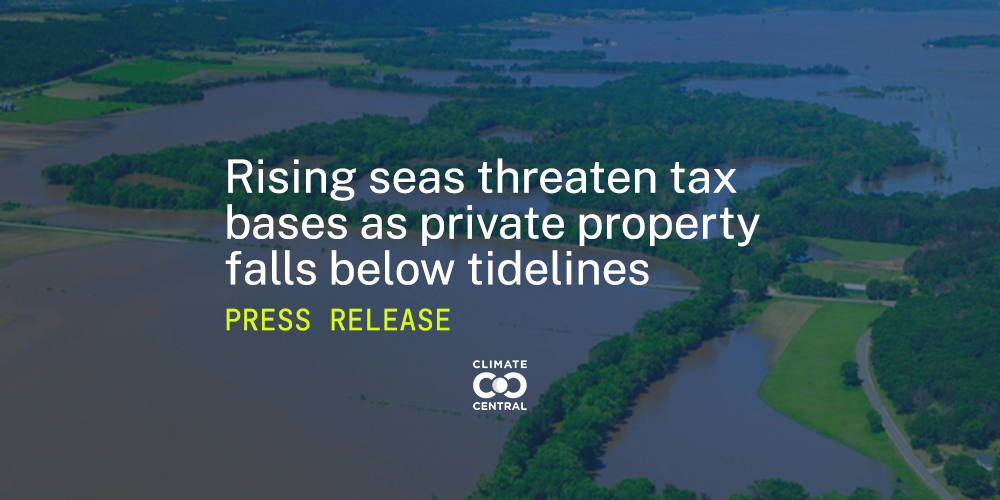
Princeton, NJ – September 8, 2022 – New analysis from Climate Central quantifies the risk of sea level rise to the tax bases of hundreds of coastal counties across 24 states and Washington, D.C. as more land falls beneath the tideline. By 2100 more than 1 million properties with a combined assessed value exceeding $108 billion are projected to be at least partly submerged at high tide.


Findings by county are detailed in more than 250 reports and a national summary including data on the acreage, buildings, number of properties, and assessed value projected to be at risk this century, by decade.

Read nationwide report, button

Sea level rise is shifting the high and low tide lines that coastal states use to define boundaries between public and private property. As these boundaries shift, private property will be lost to permanent coastal flooding. As property owners lose land and buildings, local property tax revenues may be lost, too—threatening a primary source of funding for schools and services provided by local governments.


“The financial impact of sea level rise extends far beyond coastal property owners. Even inland communities may see funding for public services erode as flooded properties come off county tax rolls,” Benjamin Strauss, Ph.D., Climate Central president and chief scientist said.

By 2050, as many as 4.4 million acres are projected to fall below the high tide line nationwide. Four states—Louisiana, Florida, North Carolina, and Texas—account for 87% of the total area lost. And 30 counties are projected to lose more than 10% of their land to rising seas.

“By filling critical gaps in knowledge, these data can help to assess which communities are most vulnerable to the economic impacts of sea level rise,” Alice Hill, Senior Fellow for Energy and the Environment at the Council on Foreign Relations said. “Understanding where and when financial impacts will be most acute can inform action and support at the state and national level, assisting local efforts to maintain critical services and adapt to our changing climate.”

More than 48,000 properties are projected to be entirely below their states’ tidal boundary levels by 2050, with roughly 64,000 buildings at least partially below the high tide line. That projection rises sharply to nearly 300,000 buildings by 2100 as water levels reach land once considered safer to build on.

“We conducted this analysis on more than 51 million individual coastal properties’ public tax records. It is mostly individuals or families at risk of losing their homes or businesses to the sea,” Don Bain, senior advisor at Climate Central and project lead on this analysis said. “Big changes are coming to future shorelines that will impact the balance sheets of some property owners and counties and cities that depend on property taxes to fund schools and local government services.”


In addition to its peer-reviewed sea level rise modeling and mapping tools, Climate Central used data from Regrid.com--a land parcel and location context data company that has collected and standardized parcel boundaries and property assessment information across all 50 states and territories--which helped us locate and assess the value of at-risk properties. Because some counties' assessment data could not be fully included in this analysis, it underestimates the total value of at-risk property nationwide.


Resources

  • Aggregated data for 320+ counties included in this analysis (by request)
  • County-level reports for 250+ counties 
  • National-level report on aggregated trends, with summary

Contact

Peter Girard, director of communications, Climate Central: pgirard@climatecentral.org, 609-986-1999


About Climate Central

Climate Central is a non-advocacy, non-profit science and news organization providing authoritative information to help the public and policymakers make sound decisions about climate and energy.

Previous Next
logo

(888) 4RE-GRID

  • Contact Us
  • Customer Support
  • Privacy Policy
  • Terms of Use

Subscribe for email updates

Company

  • About Regrid
  • Careers
  • Press

Resources

  • Coverage Map
  • Support Center
  • Reports

Support

  • Parcel Data FAQs
  • Property App FAQs
  • Contact Support Team

Customers

  • Customer Stories
  • Case Studies
  • Non Profit & Academia

Enterprise Solutions

  • Nationwide Land Parcels
  • Parcel & Tiles API
  • Feature Service

Self-Serve Solutions

  • Regrid Property App
  • Shop the Data Store
  • API Monthly Plans