


.png)


.svg)


The United States, in a Square Inch
You’re going to hear a lot about where Regrid is going as we celebrate being the first to market with a 100% United States land parcel coverage map. I want to tell you a little bit about where we came from.
As Vice President of Research & Development at Regrid one of my roles is leading a program we launched last year called Data With Purpose. We know how costly parcel data can be and also how indispensable it is for everyone from local block clubs up to national nonprofits like land trusts and conservation organizations. We started Data With Purpose as a way to license our nation-spanning parcel data to researchers, community organizations, and nonprofits on a “propose your own budget” basis that seeks to give as much budgetary flexibility to organizations in need of parcel data as possible.
A lot of companies have a program like this – often a sort of obligatory way to say they’re “giving back.” What I think is meaningful about Data With Purpose, though, is that it comes from an experience the Regrid team shared in our early days in Detroit.
I want to share a bit of that story.
1. Don't Blight Off More Than You Can Chew
Before Regrid set out to collect data on every property in the United States it mapped every square inch of a vacant lot in Detroit. It was an experiment in collective ownership of property dubbed “inchvesting” by our co-founders back in 2010.

Two of Regrid's cofounders, Jerry & Mary, talk inchvesting at TEDx Detroit
The vacant lots that became the basis for those inchvesting experiments came from tax foreclosure auctions where properties in Detroit that didn’t pay their property taxes could be purchased online for as little as $500. For years those auctions had thousands of Detroit properties churning through them and no one really knew what the properties were. Occupied homes? Vacant land? Wave after wave of tax auctions crashed on the city and few in positions of power had the time, ability, or interest to understand what they consisted of.
It was Regrid that first started mapping out the annual tax foreclosure auctions at the parcel level and asking questions about why these auctions were happening, what their consequences were, and what could be done to stop them.
To give you a sense of how consequential these massive tax auctions were to Detroit, when I joined Regrid in 2012 — and I joined because I, too, was fascinated by the tax auctions and Regrid was the only place doing anything meaningful to engage with them at a systemic level — these are the scenes that were unfolding across the city:
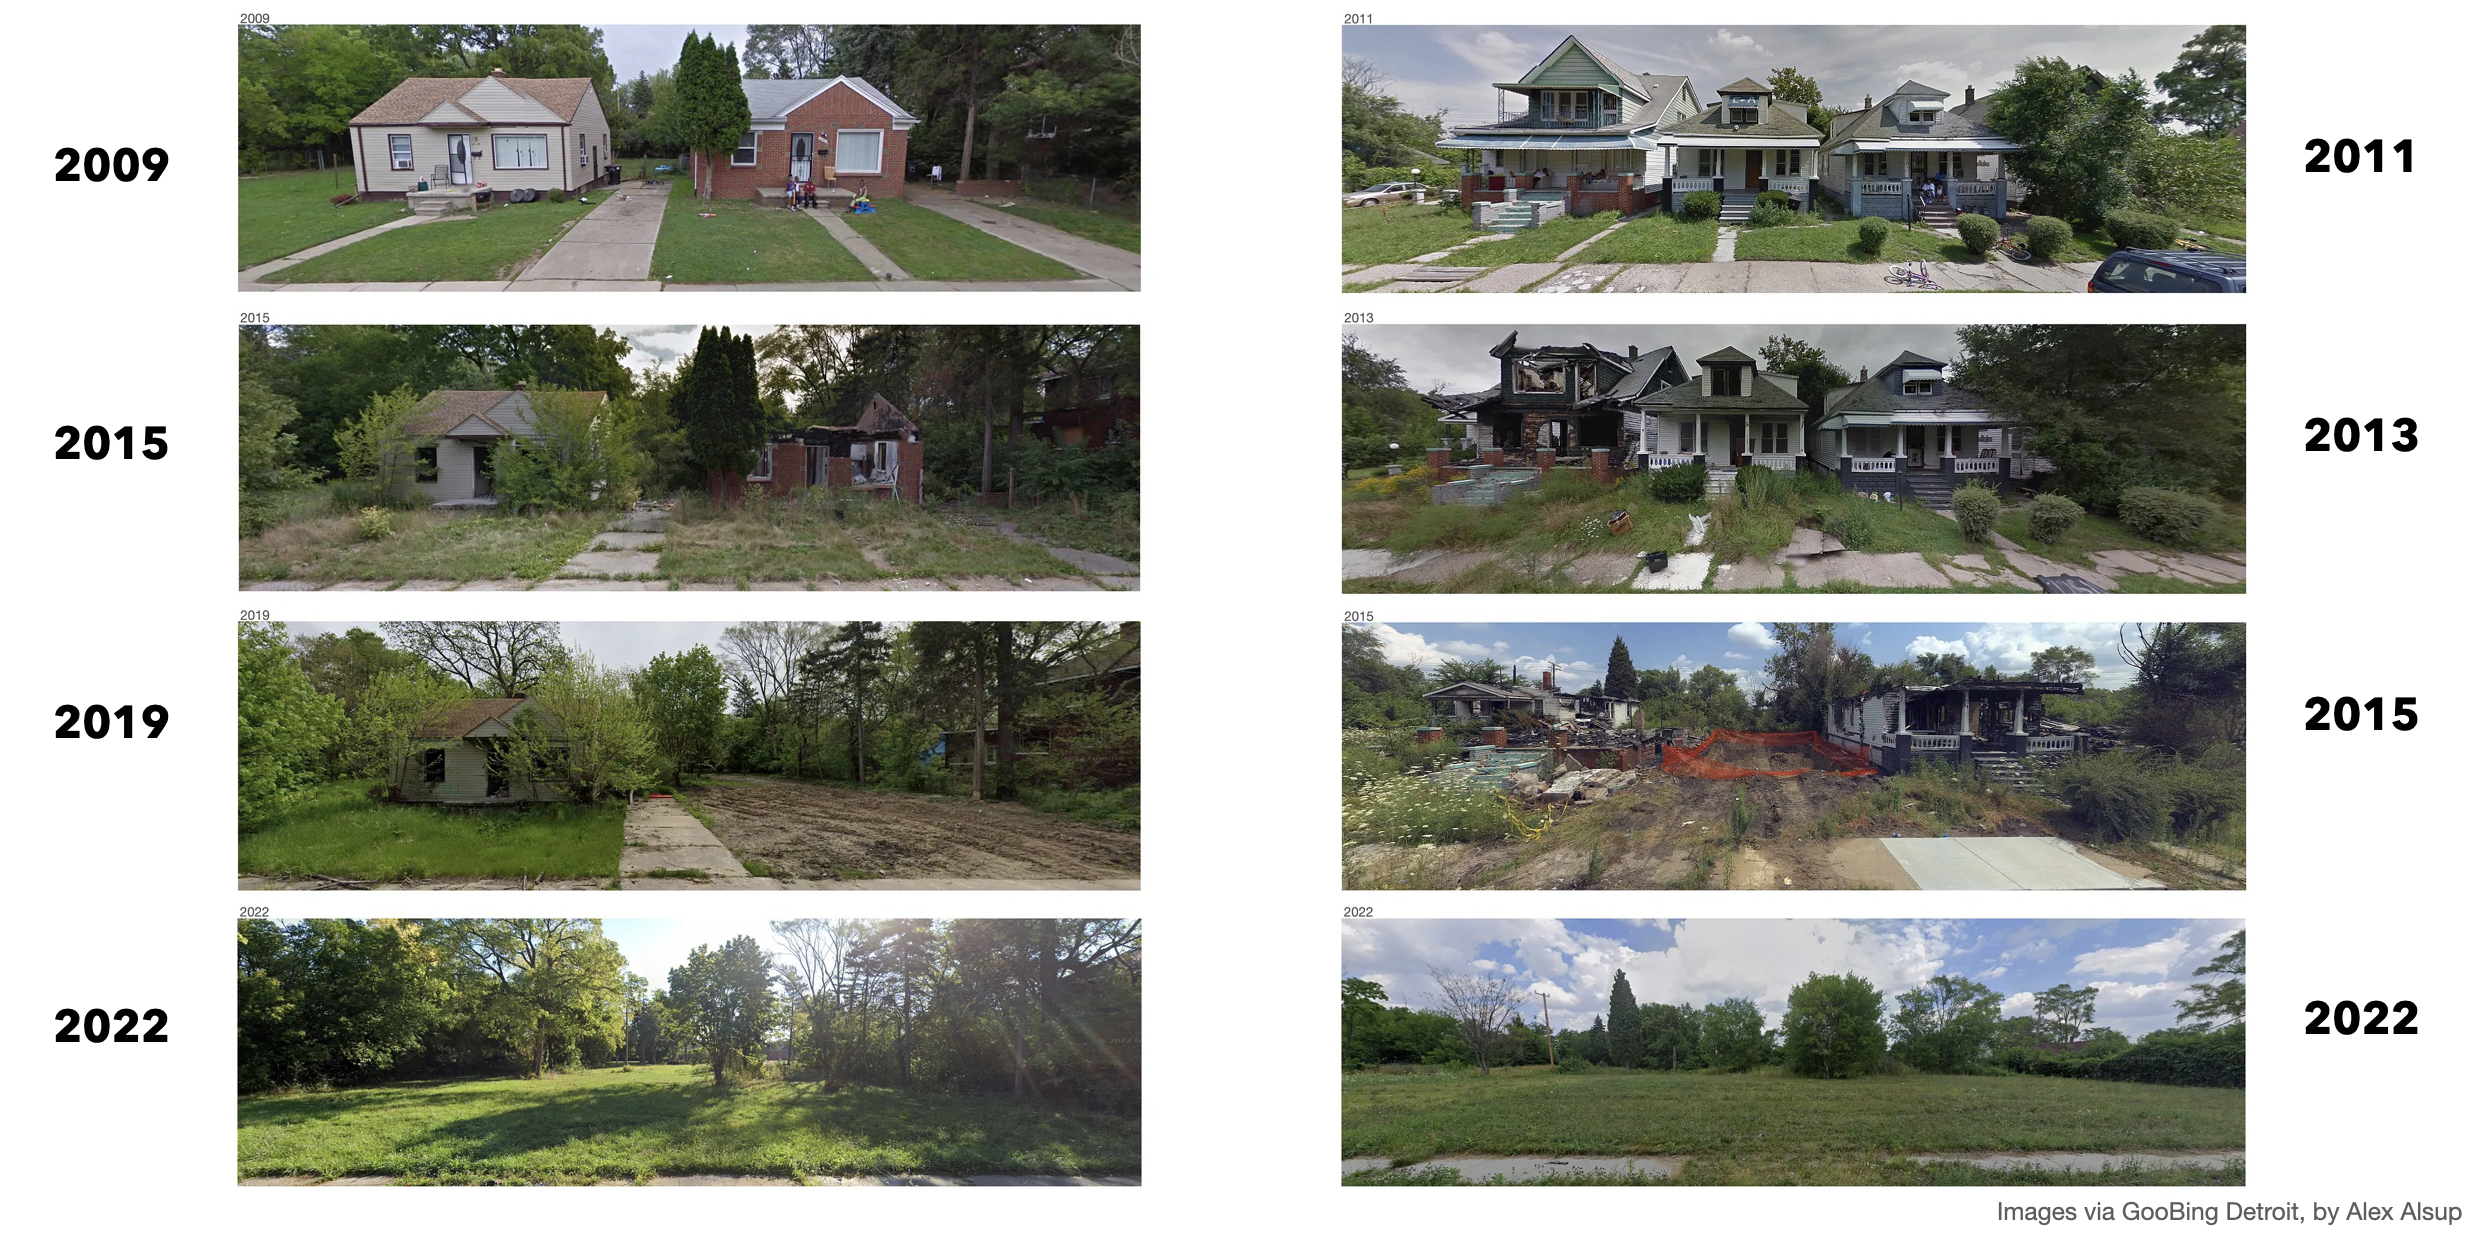
I could show you literally thousands of examples like these. They’re not hard to come by because 1/3rd of the city’s property went through tax foreclosure in a 15 year span. 155,000 properties.
In our early days we tried to shed light on these auctions – to impress upon people the scale of the problem they represented and the damage they were causing. Our first real opportunity to engage with the issue at scale came in 2013 when we were commissioned by a White House-assembled Blight Task Force as Detroit was going through bankruptcy to conduct a project called Motor City Mapping – a citywide census of Detroit property intended to help the City of Detroit plan the future of land use and how to use hundreds of millions in federal demolition funds.
Here’s a clip from 2013 where our CEO, Jerry Paffendorf, explains the project.
2. How to Shut Off a Pipeline of Tax Foreclosures
Regrid used our tools and our data to develop a depth of understanding of what was happening with tax foreclosure, and how it was driving the city’s blight and vacancy, that was truly unparalleled.
There’s a saying, “Understanding precedes action.” We thought surely now that city, county, and state officials understand they’ll act to stem the tide. But they didn’t — tax foreclosure continued unabated and, just as we warned, within a few years we could show that a new home was going vacant for every vacant home the City of Detroit erased through demolition.
We tilted at the proverbial windmills to try to get officials to change course. They say “fall in love with the problem.” We did that — probably too much.
In 2016 our Motor City Mapping partners at Rocket Mortgage launched a philanthropic wing called the Rocket Community Fund. I left Regrid and joined the Rocket Community Fund, leading their philanthropic efforts in housing. Given Rocket’s partnership on Motor City Mapping and deep investment in Detroit, there was a real commitment there to changing the dynamics of tax foreclosure in Detroit.
So I became a client of Regrid – relying on Regrid data and software each and every day to better understand what was happening with housing and tax foreclosure in Detroit and working with community organizations across the city to ensure they had the same data, the same tools, the same insights. You can read about the outcomes of that work in the report we produced at the Rocket Community Fund called Neighbor to Neighbor – a campaign that built and expanded on the work of Motor City Mapping.
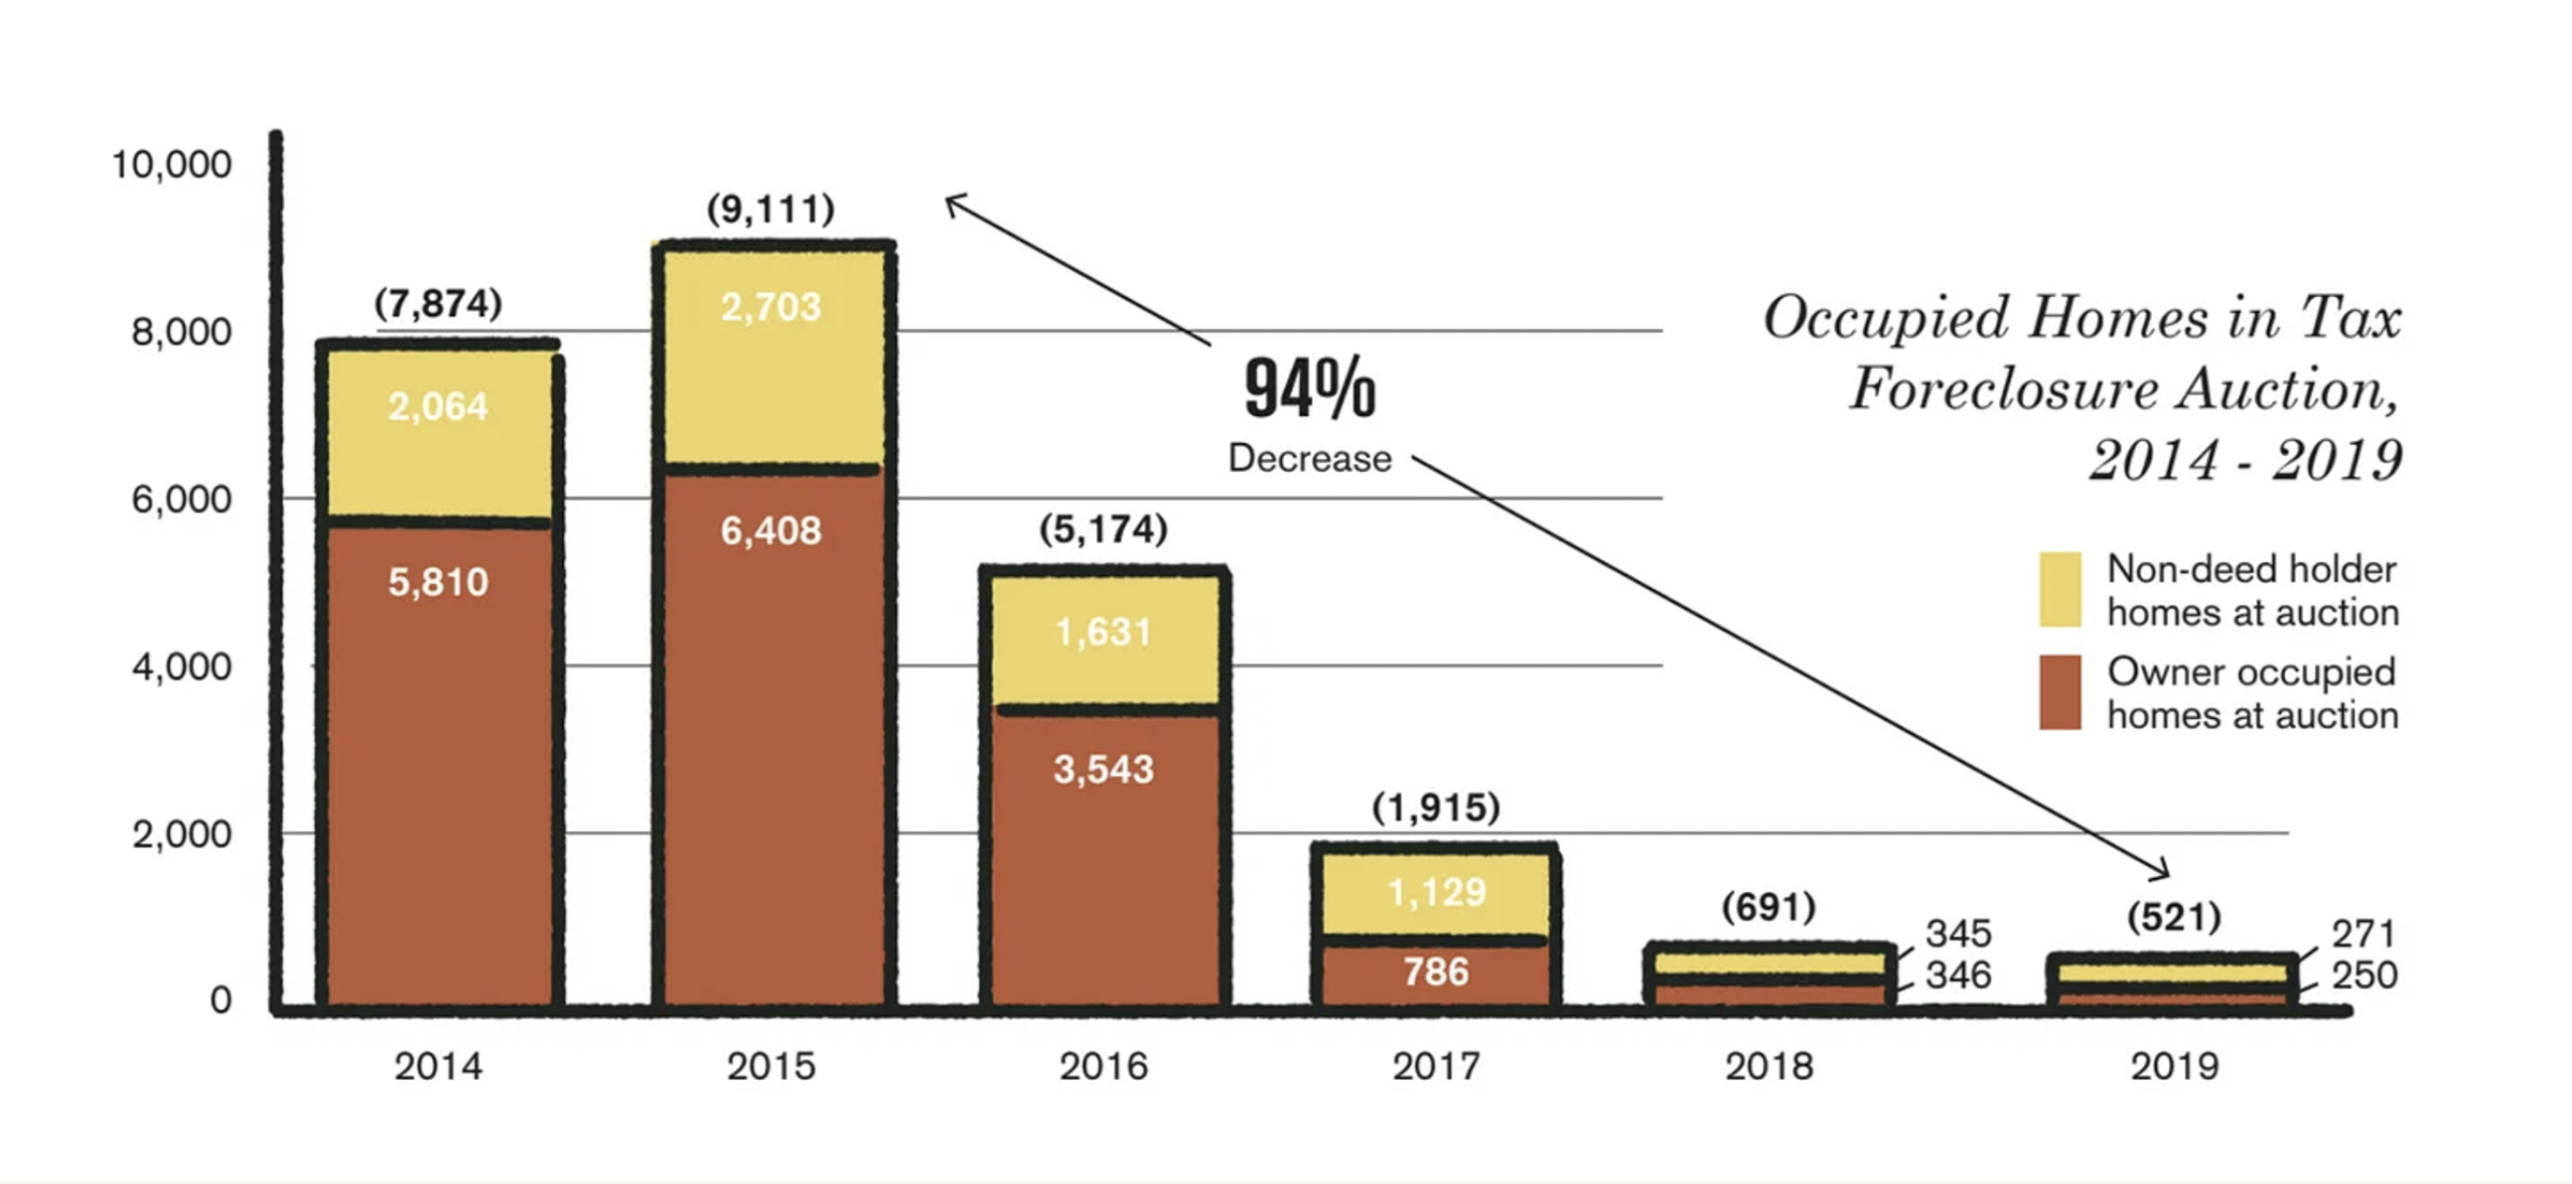
After several years of coordinated work across dozens of community organizations, city departments, and hundreds of Detroit residents, we were able to look back on a fundamentally different landscape of tax foreclosure in Detroit.
By 2019 the number of occupied homes entering tax foreclosure had fallen 94% from the peak (and has remained even lower since then):
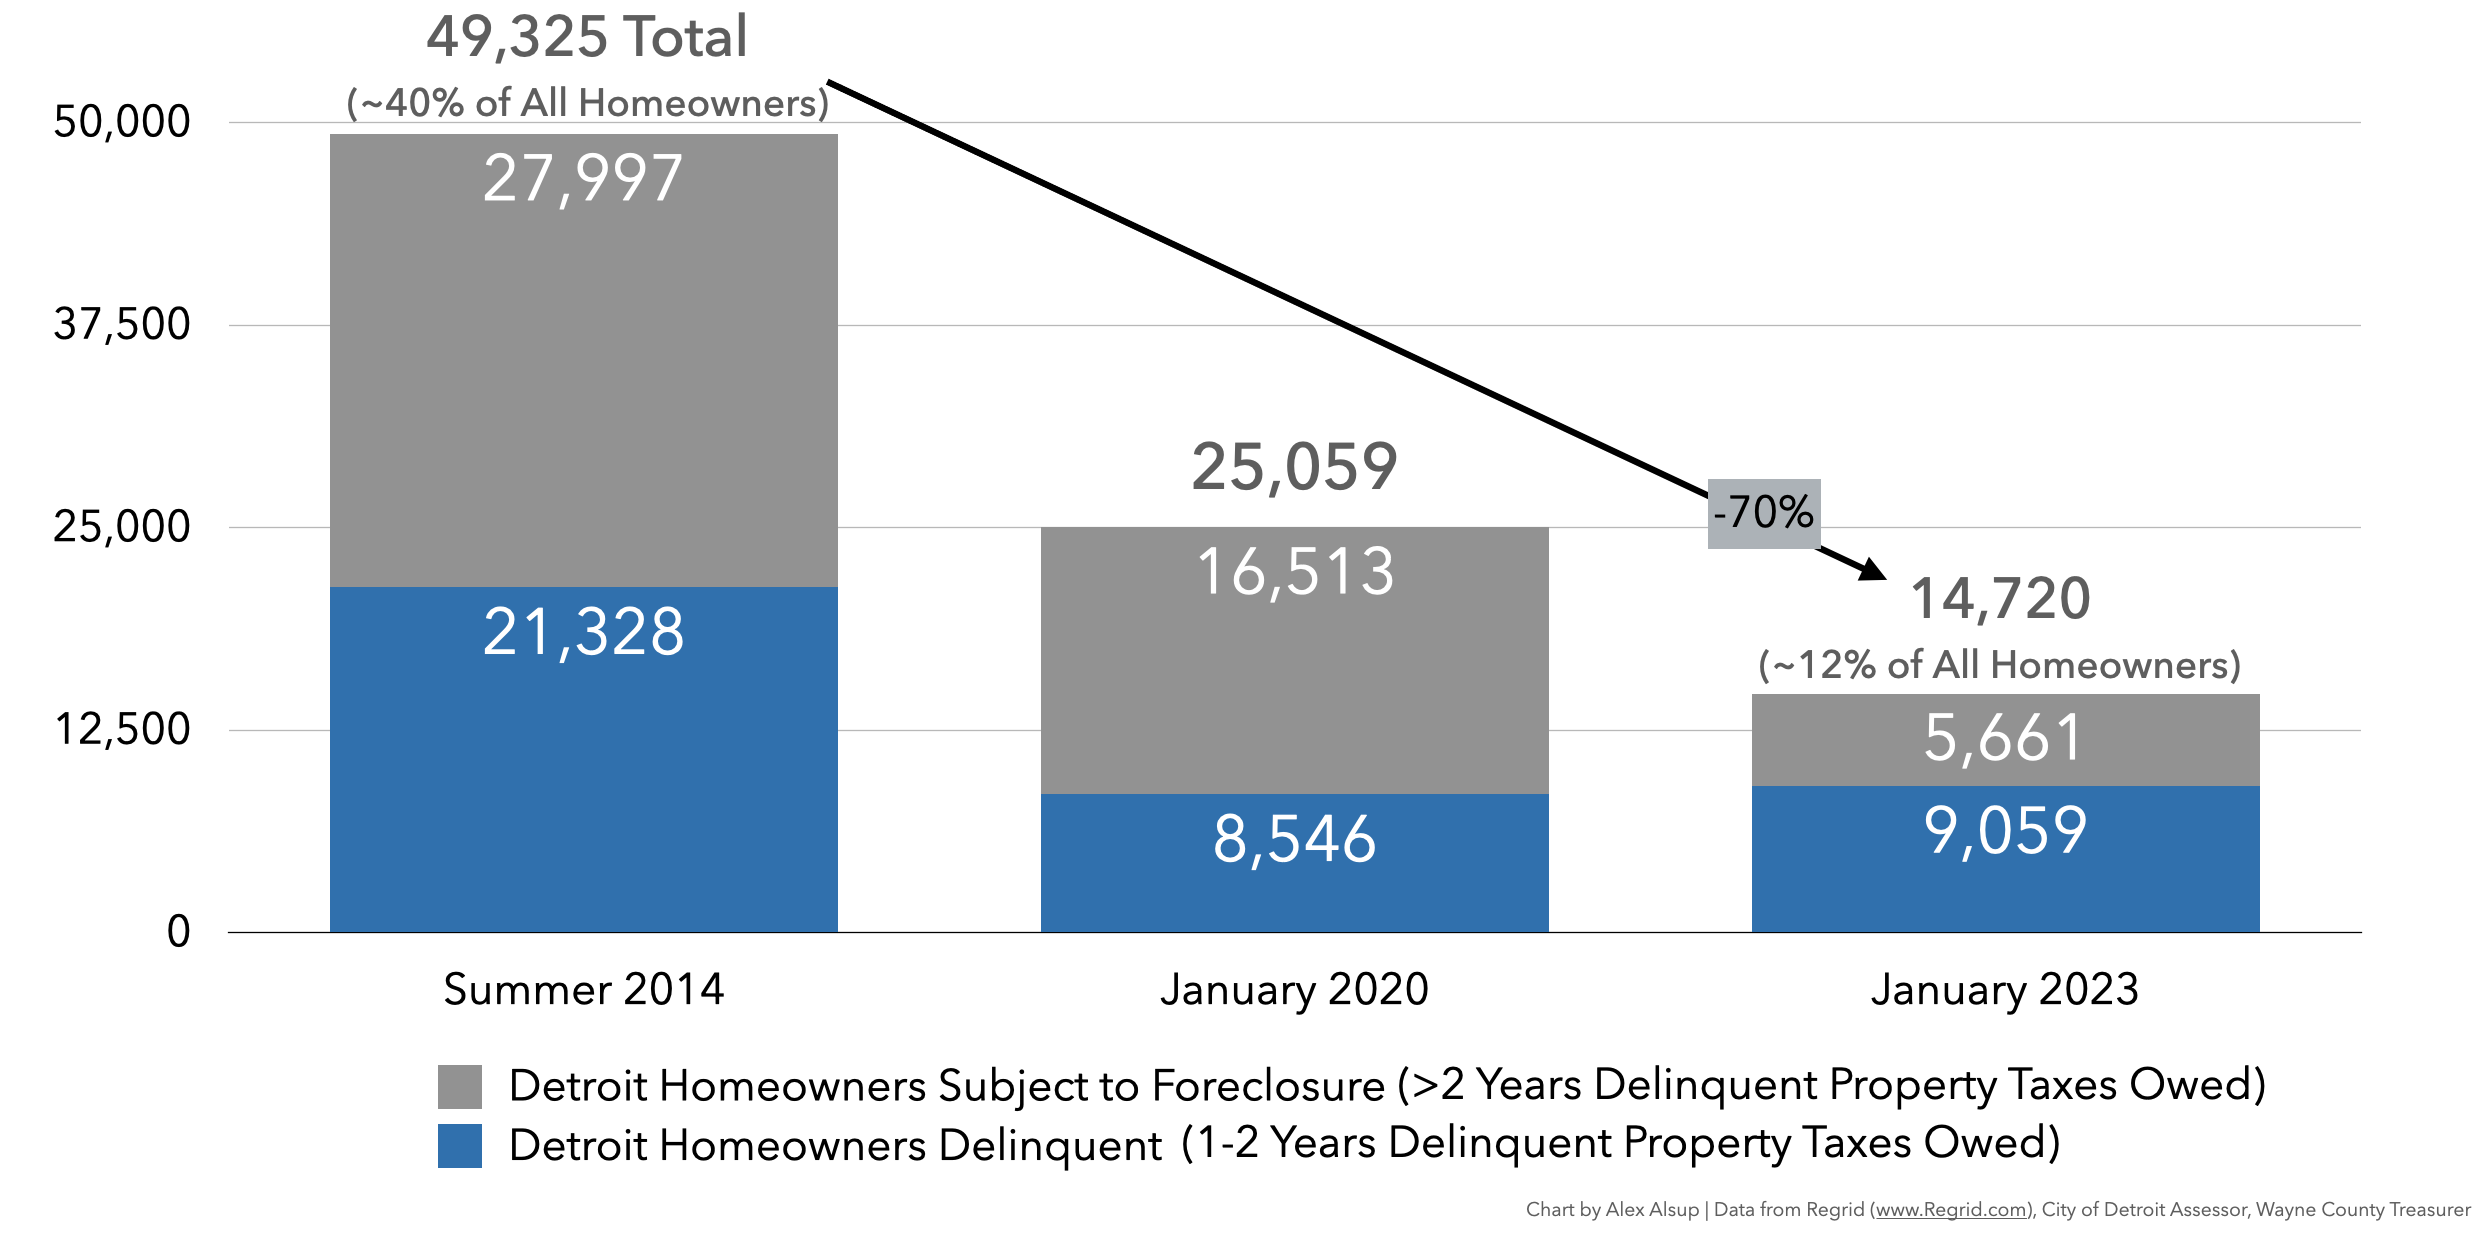
Today, the number of tax delinquent homeowners in Detroit is down 70% from where it was at the time of Motor City Mapping:
3. From One Vacant Lot to 3,200+ Counties
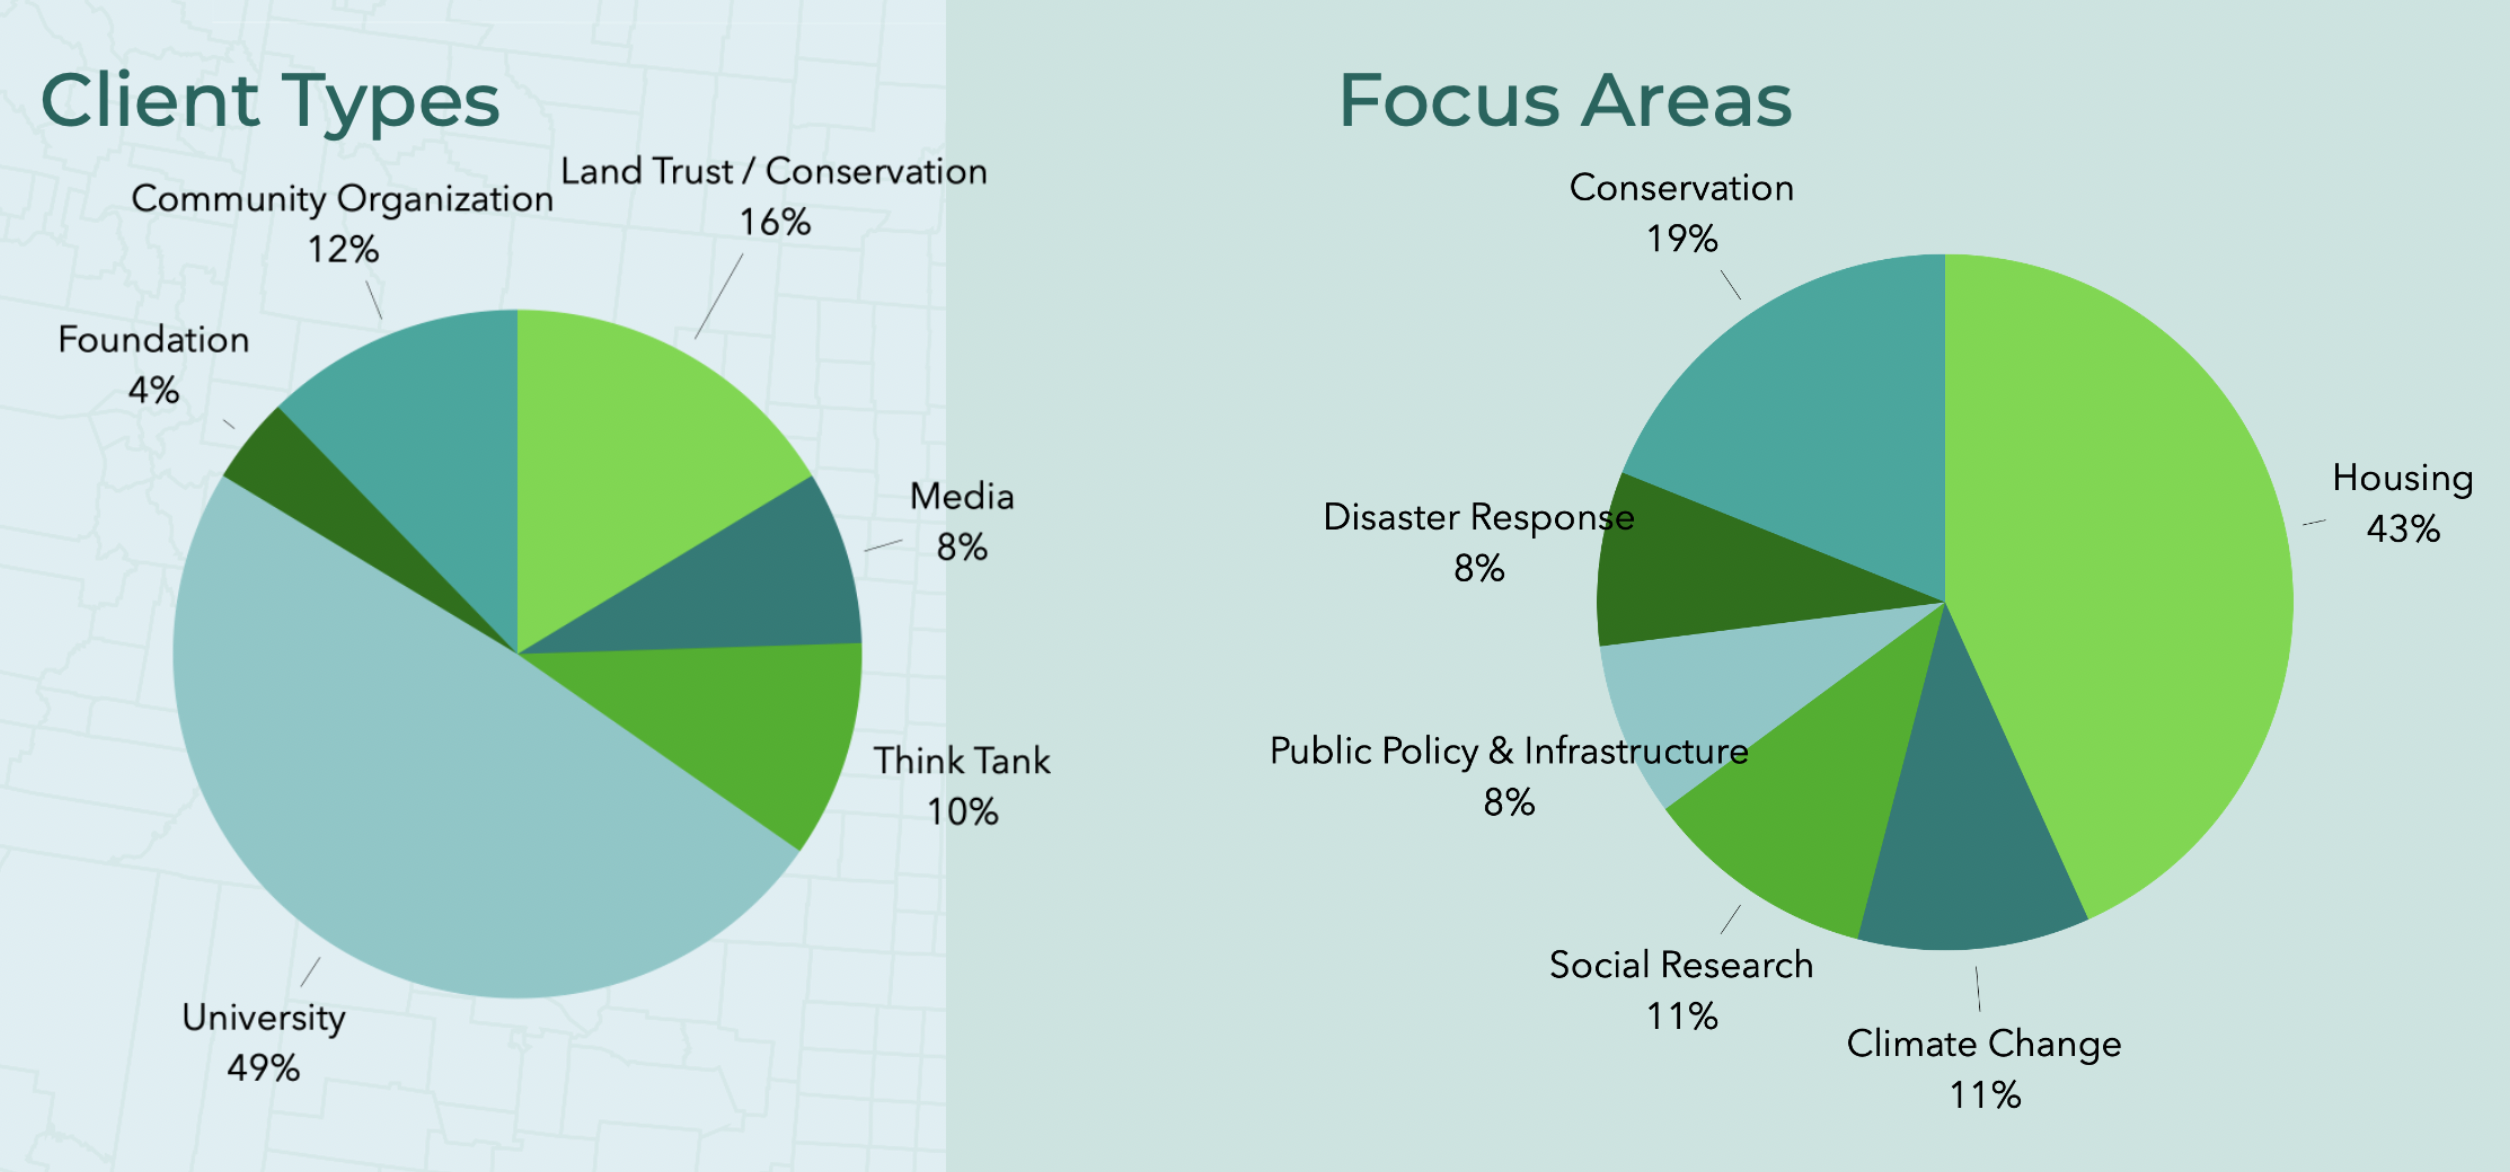
Today, Regrid’s Data With Purpose program delivers the benefits of our nationwide parcel data coverage, and our insights and experience in how to make the most of it, to more than 50 organizations across the United States and beyond.
These nonprofit partners run the gamut from small block clubs in Milwaukee to undergraduate research projects in South Carolina – from journalism at ProPublica to national land trusts powering conservation like The Conservation Fund and Trust for Public Land.
As we look back on our journey from inchvesting in Detroit to being the first to market with a 100% United States land parcel coverage map, it's clear that our mission remains steadfast: to provide accurate, accessible, and actionable parcel data for those who need it the most.
This commitment has shaped our past, defines our present, and will guide Regrid’s future.
Through programs like Data With Purpose we are not just part of the conversation; we're enabling real, systemic change. As we celebrate the milestone of a 100% United States land parcel coverage map, we also renew our commitment to leverage this vast data resource for public good and to a future where data doesn't just inform but transforms, turning insight into impact at scale.
