
-
Products ⌄
 Premium parcels
 AI and ML tools
 Roadway ROW
 Spatial add-ons
 Delivery methods
- Industries ⌄
- Data store
- Property App
- Esri users
- Resources ⌄
- Contact us
































-
Products ⌄
AI and ML tools
Roadway ROW
-
Industries ⌄
-
Resources ⌄
CASE STUDY | RESEARCH & EDUCATION
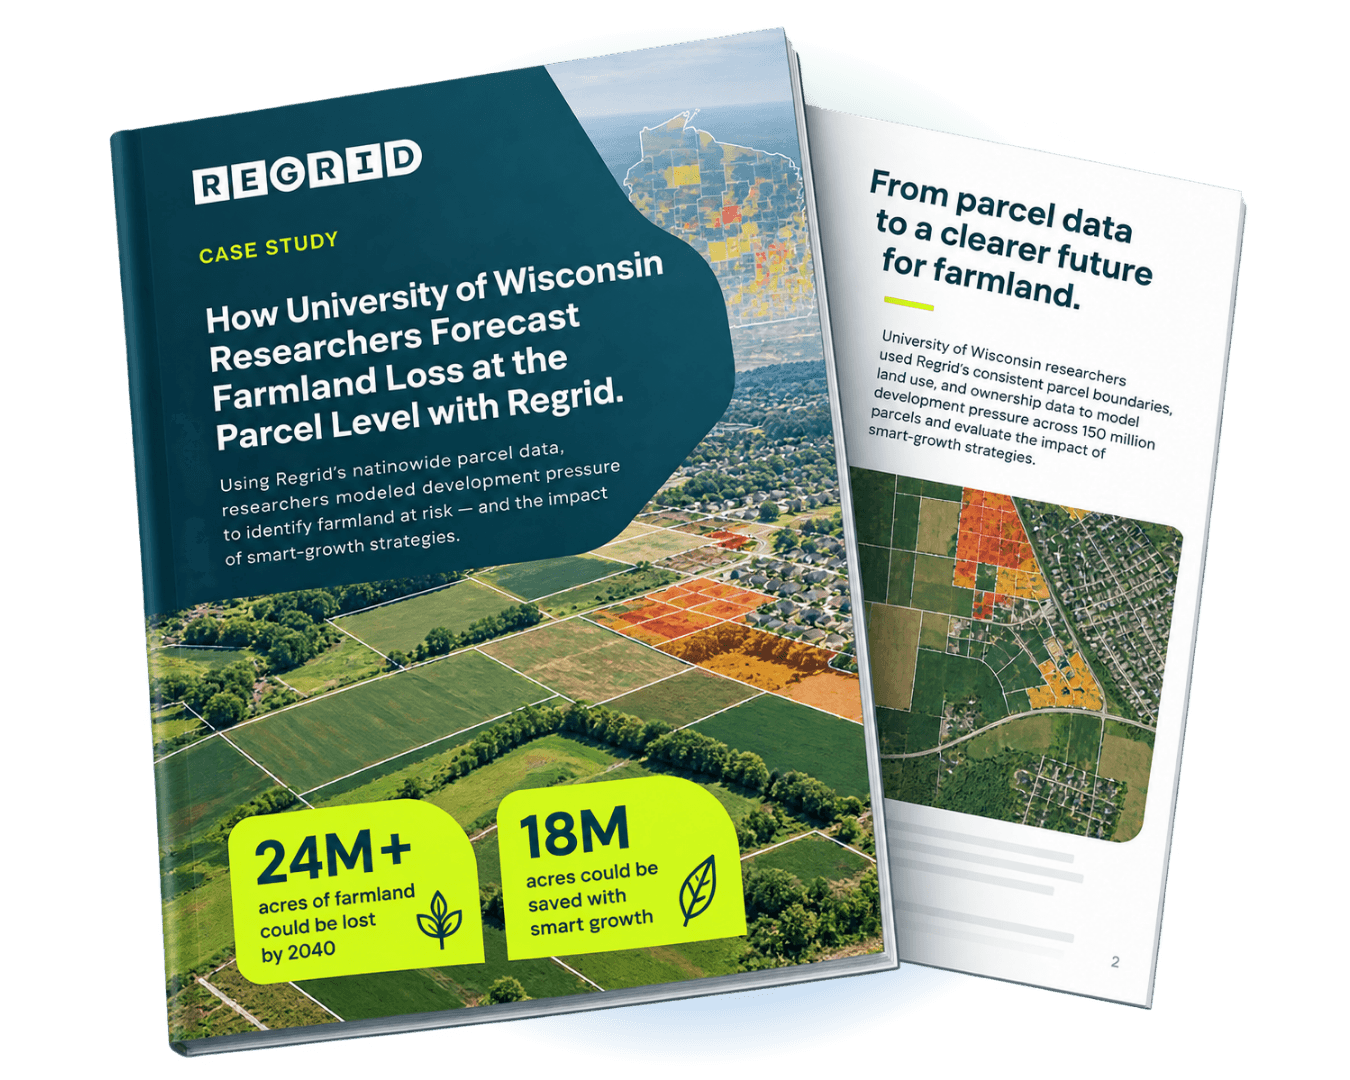
How University of Wisconsin researchers used Regrid to forecast farmland loss at the parcel level
Discover how researchers used nationwide parcel data to model development pressure, identify farmland at risk, and evaluate how smarter growth could protect millions of acres by 2040.
CHALLENGE
America's farmland faces growing pressure from low-density development, but traditional forecasts often lack the property-level detail needed to identify vulnerable land and guide local conservation decisions.
SOLUTION
Using Regrid's nationwide parcel data, University of Wisconsin researchers modeled development pressure at the property level, revealing how much farmland could be lost by 2040 and how smart-growth strategies could help protect it.
ABOUT
Forecasting the future of America's farmland to inform land protection
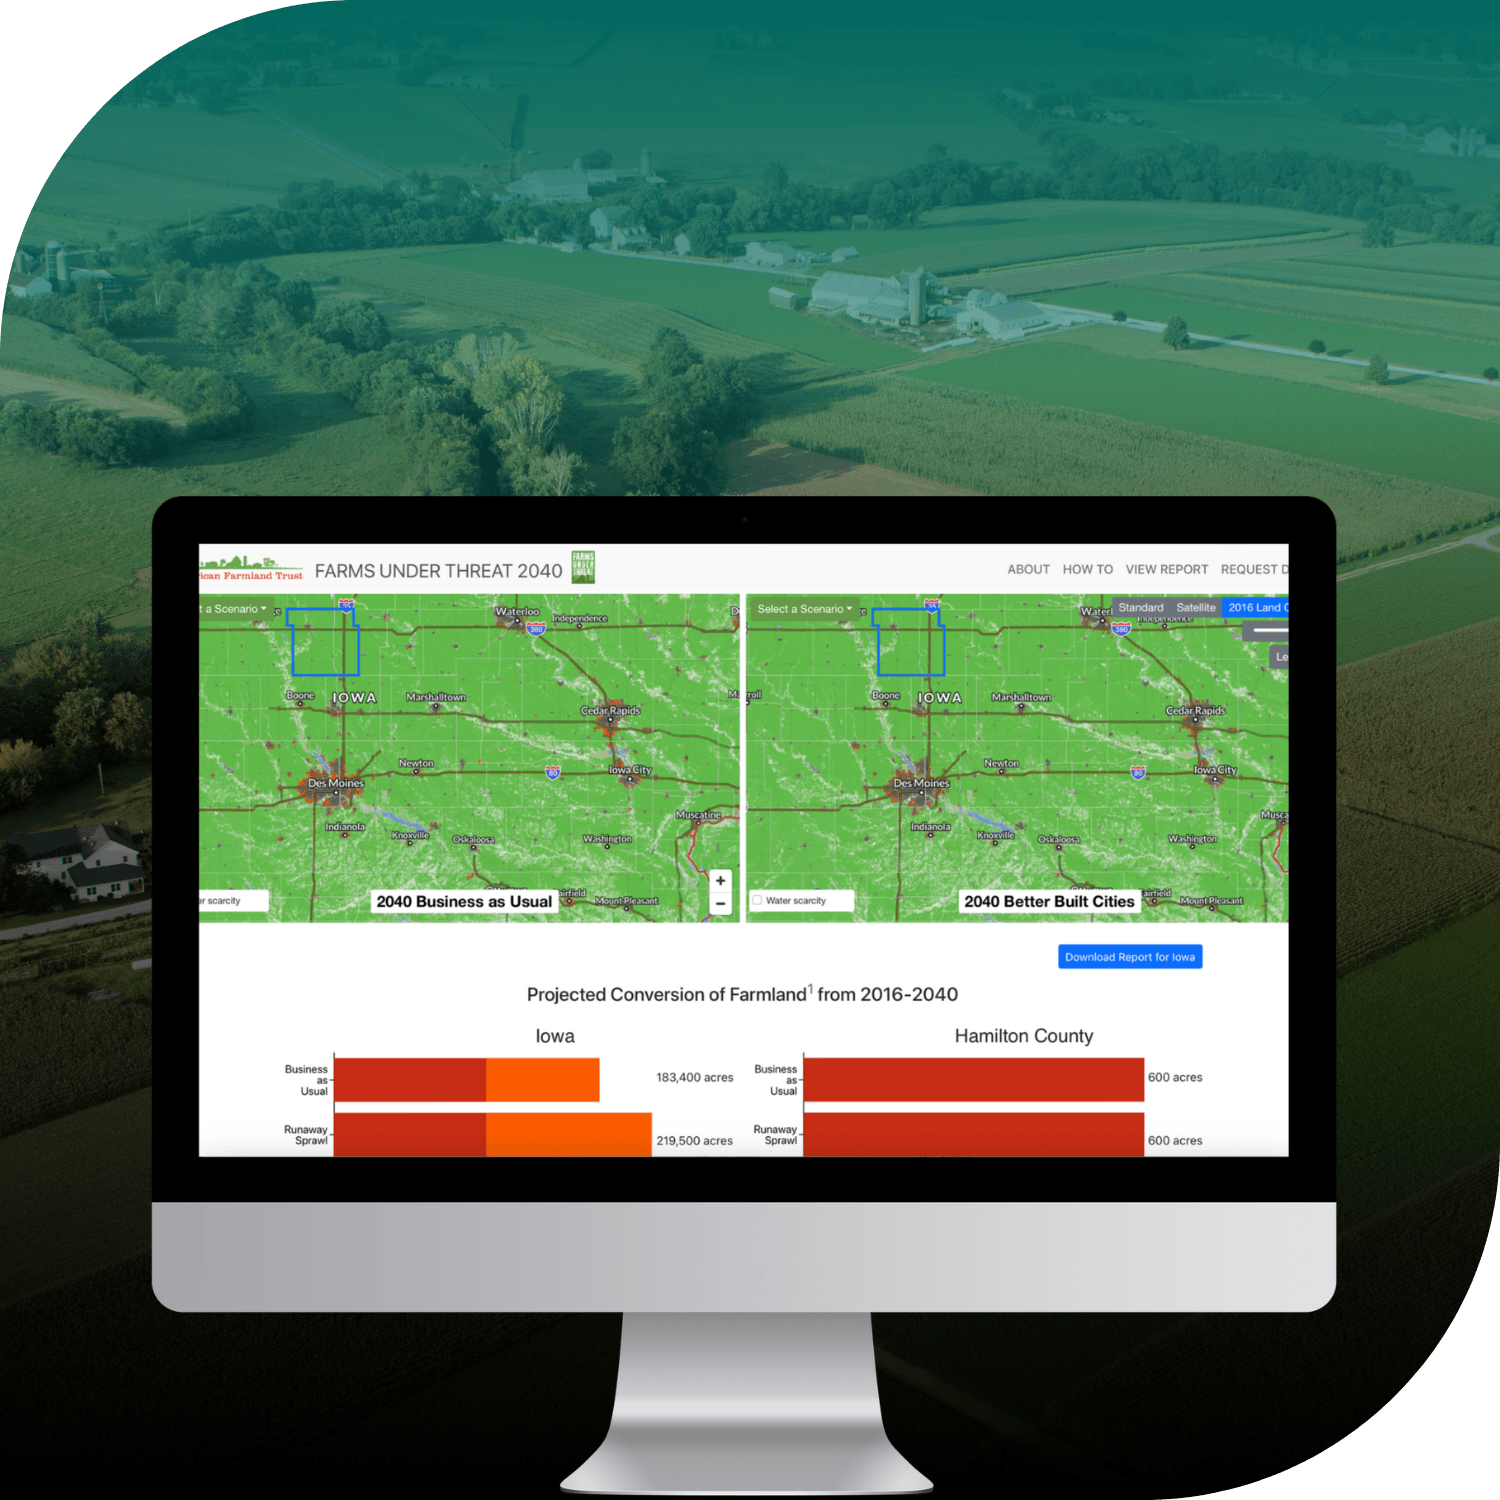
Farms Under Threat 2040 is a research project led by the University of Wisconsin's SAGE Lab for the American Farmland Trust.
The project examines how urban sprawl and low-density development could affect America's agricultural land by 2040. By modelling potential farmland loss under different development scenarios, the researchers aim to help planners, policymakers, and conservation organisations understand where agricultural land is most vulnerable and how it could be protected.
CHALLENGE
Identifying which farmland is most at risk from future development
Across the United States, farmland is increasingly being converted to residential and other low-density development, threatening agricultural production, rural communities, and long-term land conservation.
For planners and policymakers, understanding the scale of this loss is only part of the challenge. They also need to know where development pressure is greatest, which properties are most vulnerable, and how different growth strategies could affect future land use.
Traditional land-use forecasts can identify broad development trends, but often lack the geographic detail needed to guide decisions at the local level.
To make its forecasts more useful for conservation planning, the research team needed consistent nationwide property data that could support development modelling at the individual parcel level.
SOLUTION
Combining nationwide parcel data with land-use modelling to forecast development
University of Wisconsin researchers used Regrid's nationwide parcel dataset, covering approximately 150 million properties, as a consistent spatial foundation for their analysis.
The parcel boundaries and associated property information enabled the team to integrate additional datasets, including satellite imagery, zoning, land use, and infrastructure data, into a unified modelling framework.
Researchers then simulated future development under two scenarios: one assuming current sprawl patterns continue, and another reflecting smarter growth strategies.
By analysing development pressure at the parcel level, the team could identify where agricultural land was most likely to be converted and estimate how much farmland could potentially be preserved through alternative planning approaches.
Regrid's standardised parcel data helped bridge the gap between nationwide development forecasts and the individual properties where land-use decisions ultimately take place.
“Regrid’s parcel data has been instrumental in helping us translate diverse data into property-level insights at the scales that matter for decision making.”
- Tyler Lark
RESULTS
Revealing how smarter growth could protect 18 million acres of farmland by 2040
The research revealed that more than 24 million acres of American farmland could be lost to development by 2040 if current sprawl trends continue.
Importantly, the modelling also demonstrated that smart-growth strategies could potentially save 18 million of those acres, illustrating the substantial influence of future land-use decisions.
Because the analysis was conducted at the parcel level, the findings provide more than a national estimate of farmland loss. They help planners, policymakers, and conservation organisations understand where development pressure is building and where land protection efforts could have the greatest impact.
For public agencies, the research provides insights to inform growth planning. For conservation organisations, it helps identify vulnerable agricultural land and prioritise protection strategies.
By making parcel-level analysis possible across the country, Regrid helped researchers turn complex development forecasts into geographically specific insights that can support more informed decisions about the future of America's farmland.
See how Regrid has helped others

















(888) 4RE-GRID
Subscribe for email updates