
-
Products ⌄
 Premium parcels
.png) AI and ML tools
AI and ML tools
 Roadway ROW
 Spatial add-ons
 Delivery methods
- Industries ⌄
- Data store
- Property App
- Esri users
-
Resources ⌄
 Content
 Programs
.png) Shop
Shop
- Contact us








.svg)

.png)






















-
Products ⌄
AI and ML tools
Roadway ROW
-
Industries ⌄
-
Resources ⌄
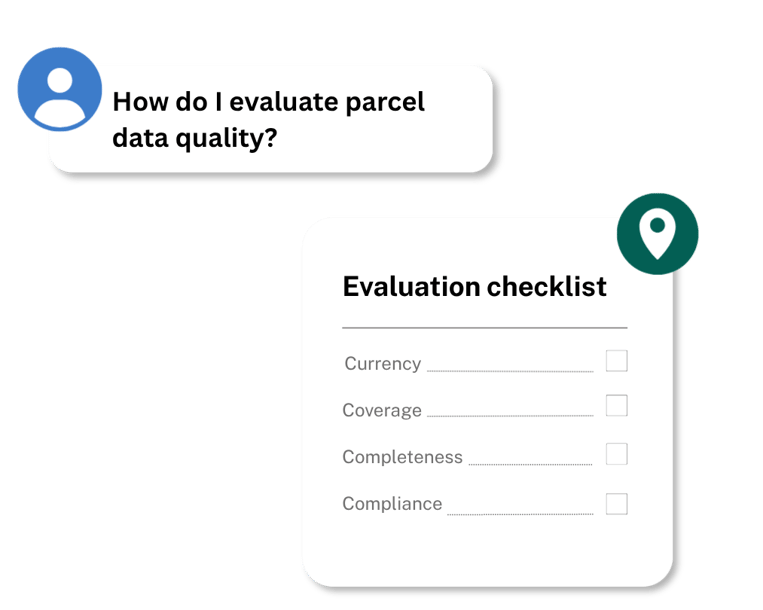
Jump straight to:
Data currency: How current is the data you actually need?
Data coverage: Does the dataset contain what you need, where you need it?
Completeness: Are the important fields populated often enough?
Ownership: Look beyond “Do you have owner names?”
Provenance: Can you tell where the data came from?
Standardization and schema: Can you work across jurisdictions consistently?
Geometry and data processing: How should parcel boundaries be evaluated?
Compliance: Is the data handled in line with applicable requirements?
Transparency: Can you investigate the claims before you buy?
How to evaluate parcel data quality: A buyer’s guide
How can you tell whether a parcel-data provider actually has the right data for your needs, rather than simply the most parcels, the most fields, or the strongest headline claims?
Key takeaway: Evaluating parcel-data quality means looking beyond coverage claims and field counts.
This guide explains how to assess the factors that determine whether a dataset is a genuine fit for your workflow, including currency, coverage, completeness, provenance, standardization, parcel geometry, compliance and transparency.
Parcel data varies by geography, source, and field. A strong evaluation focuses on the specific information and locations your organization depends on, and whether the provider gives you enough evidence to judge that data before you commit.
➡️ Parcel count and field count are not enough. Evaluate the currency, coverage, completeness, and suitability of the specific data your workflow depends on.
➡️ Context matters. Understand where fields come from, how they have been standardized or processed, and why availability can vary between jurisdictions.
➡️ Look for evidence, not just claims. Schema documentation, field-level coverage, refresh information, methodology, and representative sample data make it easier to determine whether a parcel dataset is right for your use case.
Parcel data can look straightforward: a parcel boundary, an owner name, an address, an assessed value, a land classification code.
The harder question is whether those fields are current, populated, consistently defined and suitable for the decisions you need to make.
Much of U.S. parcel information originates in local government systems. Those sources do not necessarily publish the same information, use the same terminology or update on the same schedule. A nationwide dataset therefore has to bring together records that differ in both structure and content.
That makes parcel-data quality use-case dependent.
For an enterprise team, that job might be powering a GIS environment, feeding an internal application, supporting analysis across many jurisdictions or maintaining a recurring data pipeline. Each places different demands on the fields, currency, consistency, delivery and spatial precision the dataset needs to provide.
A field that is essential for one workflow may be irrelevant to another. A coverage gap in a county you never use may not matter at all, while missing ownership data in a core market could make a dataset unsuitable for your project.
Before comparing providers, define three things:
-
-
- the geographies you need;
- the attribute fields and datasets your workflow depends on; and
- the decisions or systems that the data needs to support.
-
Then evaluate whether the provider can deliver the right information, in the right places, with enough currency, consistency and transparency for that job.
At Regrid, we think about data quality through four core considerations: currency, coverage, completeness and compliance. A thorough buyer evaluation should also consider provenance, standardization and schema design, parcel geometry, and how much evidence a provider makes available before you commit.
In this guide, we’ll break down the key dimensions of parcel-data quality — from currency, coverage and completeness to provenance, standardization, geometry and transparency — and show what to look for when comparing providers so you can determine whether a dataset is fit for your specific workflow.
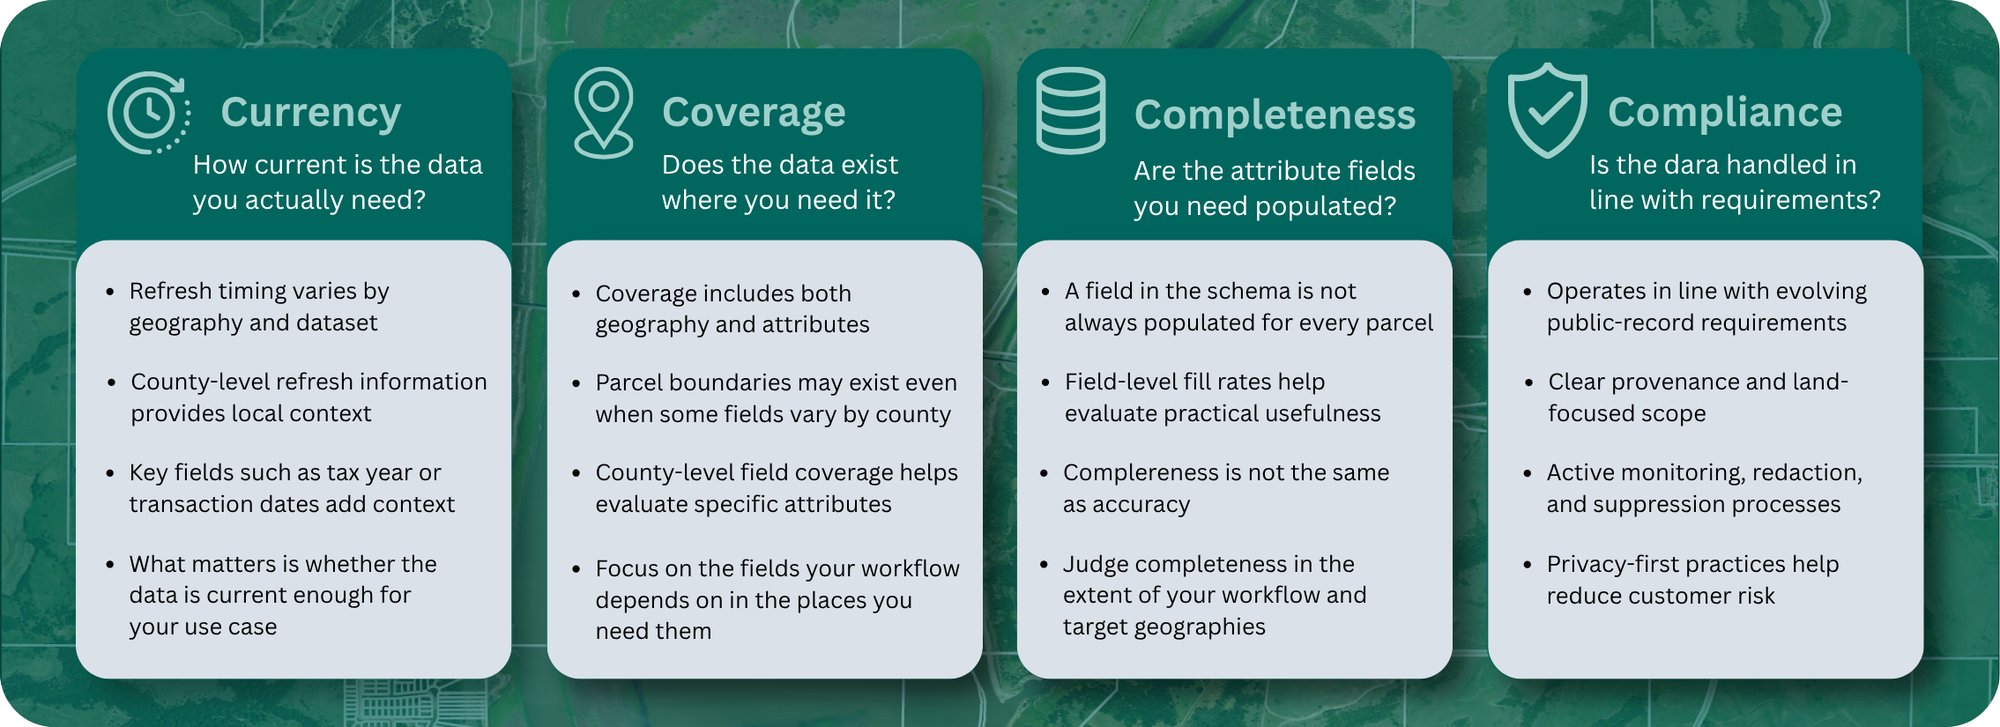
The 4Cs of Regrid data quality: A practical framework for evaluating whether parcel data is fit for your workflow
Parcel data does not have one universal refresh date.
Local authorities publish updates on different schedules, so a useful currency assessment needs to look at the specific geography and dataset your workflow depends on.
Regrid tracks when it most recently refreshed parcel data from its source through ll_last_refresh and publishes geography-level refresh information at the county (or county-equivalent) level. Separate matched datasets also have their own currency information.
But evaluating currency should go beyond the date shown in a coverage report. Different sources can represent currency differently, and not every element within a parcel record will necessarily update at the same time.
Important attributes within the data itself — such as tax year or transaction dates — can provide additional context about how current the information is for the question you are trying to answer.
When evaluating a provider, ask:
-
-
- When was data for the places we care about last refreshed?
- What does that refresh date actually represent?
- How does the source represent currency within the dataset itself?
- Do key attributes, such as tax year or transaction dates, provide additional information about currency?
- Do important enrichments have their own update schedules?
- If different elements of the parcel data update at different times, how is that reflected in the data?
- Is the level of currency appropriate for your use case?
-
A newer refresh date is not automatically better if the underlying information rarely changes. What matters is understanding what was refreshed, what the relevant fields tell you about their own currency, and whether the data is current enough for the decisions you are making.
🔗 Learn more: How should you evaluate parcel-data currency?
📄 See our monthly release notes for a full list of counties updated each month
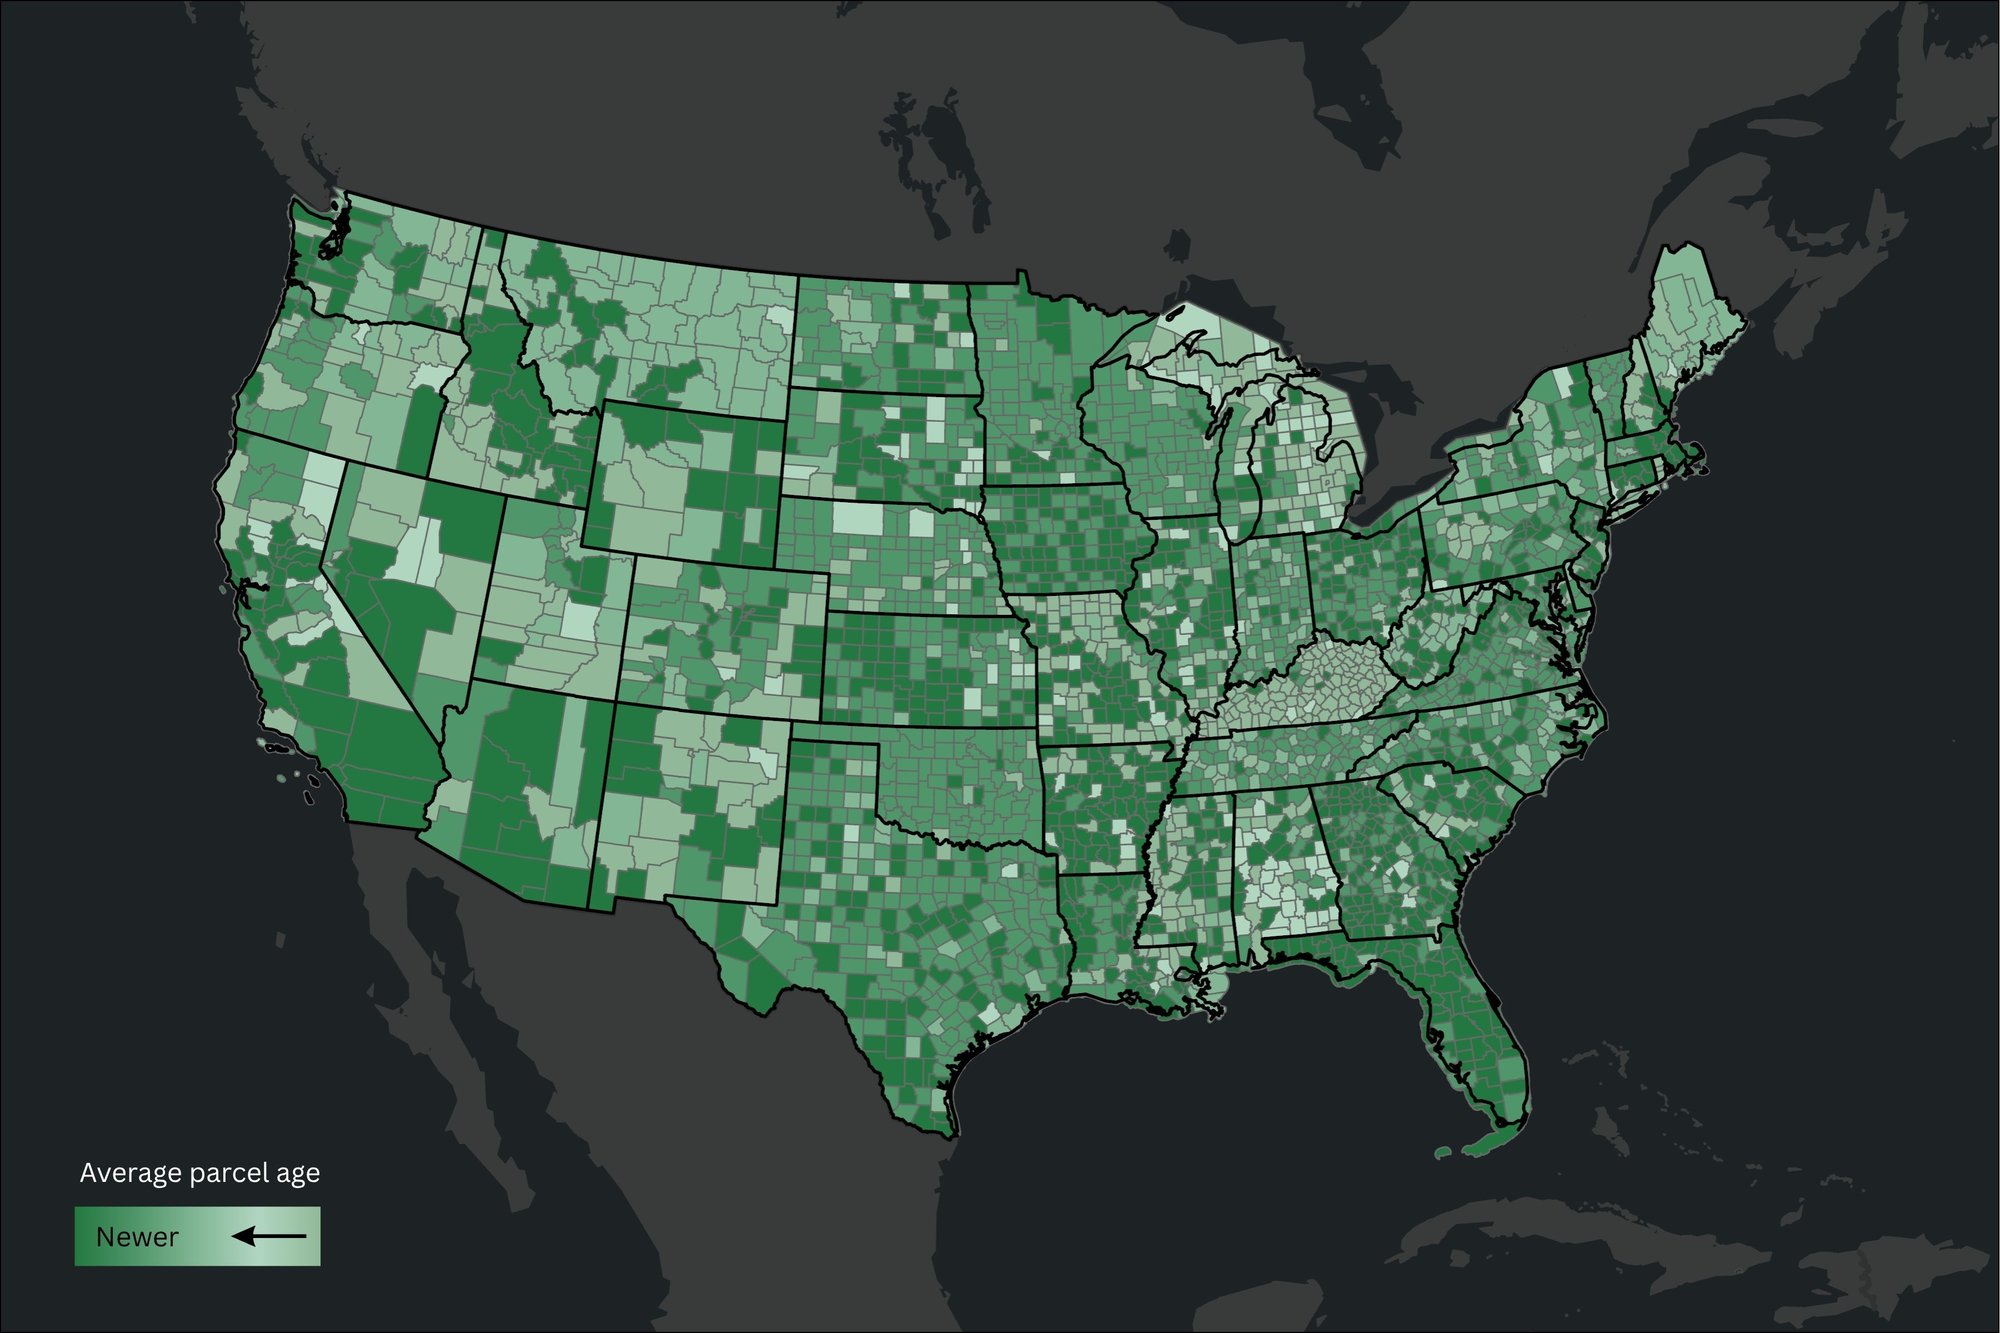
Regrid publishes currency data per county. See when a county was last updated here.
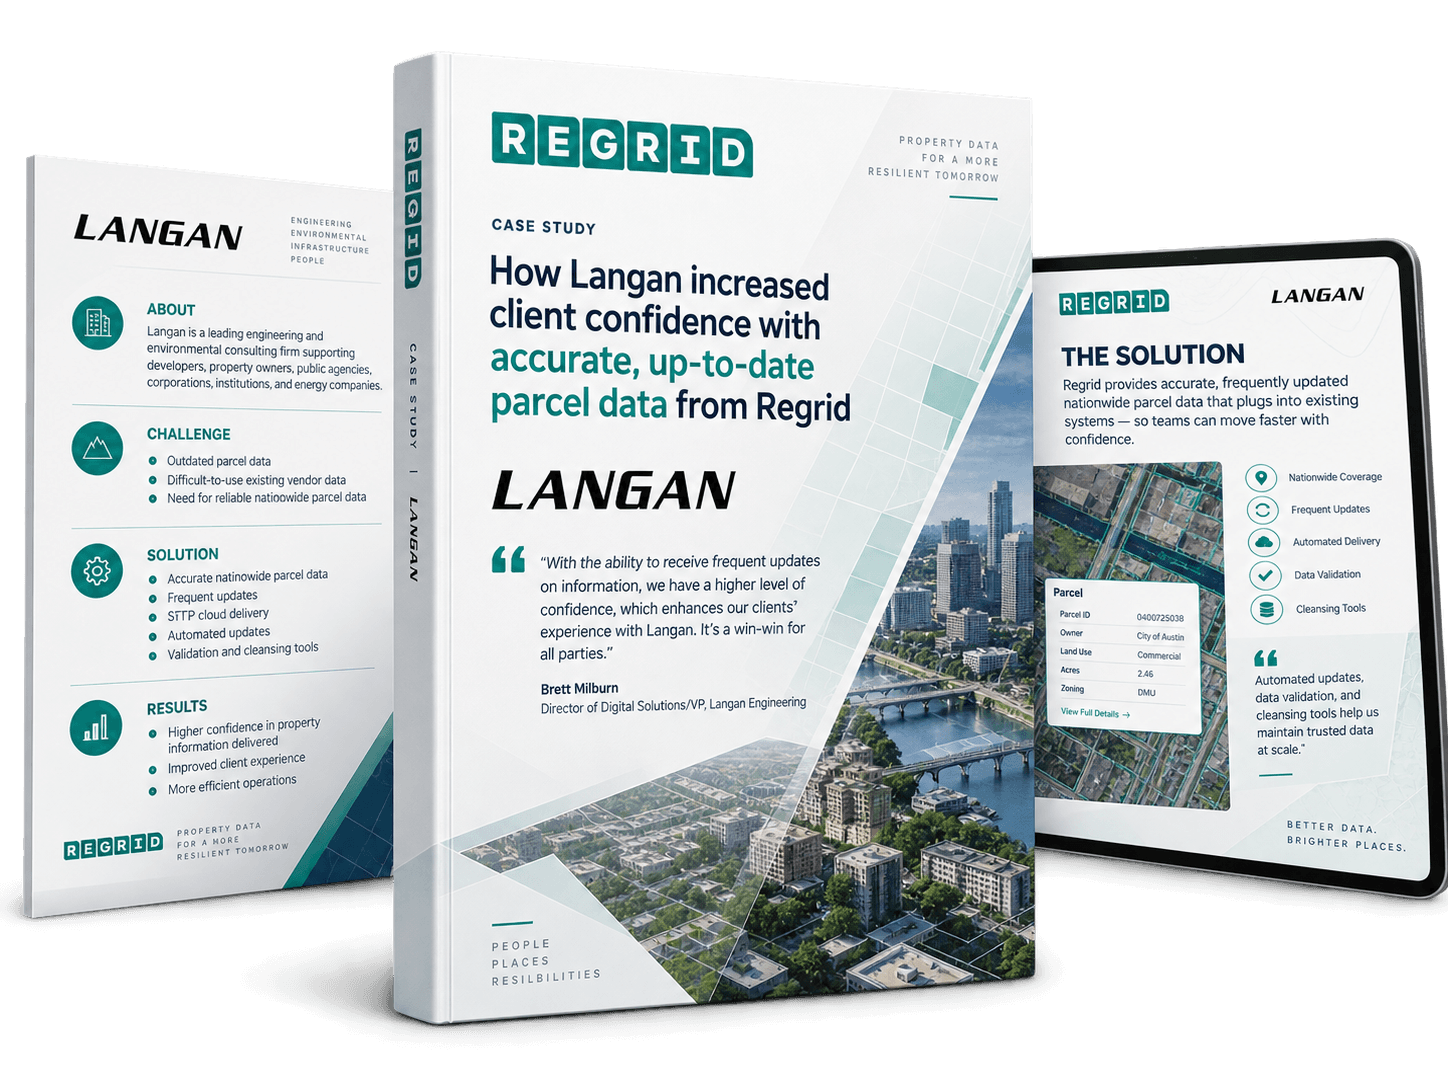
Customer example: How Langan use Regrid to improve confidence in parcel-data currency and quality
Langan came to Regrid after their existing parcel-data provider was delivering outdated information that was difficult to use in their internal applications. With regularly refreshed Regrid data, automated updates, validation and cleansing, the team at Langan now have greater confidence in the property information they deliver to clients.
Coverage has two different dimensions.
Geographic coverage tells you whether parcel records and boundaries exist within the jurisdictions, counties or locations you need.
Attribute coverage tells you what proportion of parcels have a populated value for each individual field.
Those are not the same thing.
A provider can have parcel boundaries across a geography while owner names, mailing addresses, land-use classifications or other attributes vary significantly from one jurisdiction to another.
One of the main reasons for such discrepancies is that parcel data is locally controlled. Different jurisdictions have different priorities around what information they collect and maintain, and local or state laws can also affect what they are permitted to track or make publicly available. Some jurisdictions may not collect a particular attribute at all, while others may be required to redact certain information from public records.
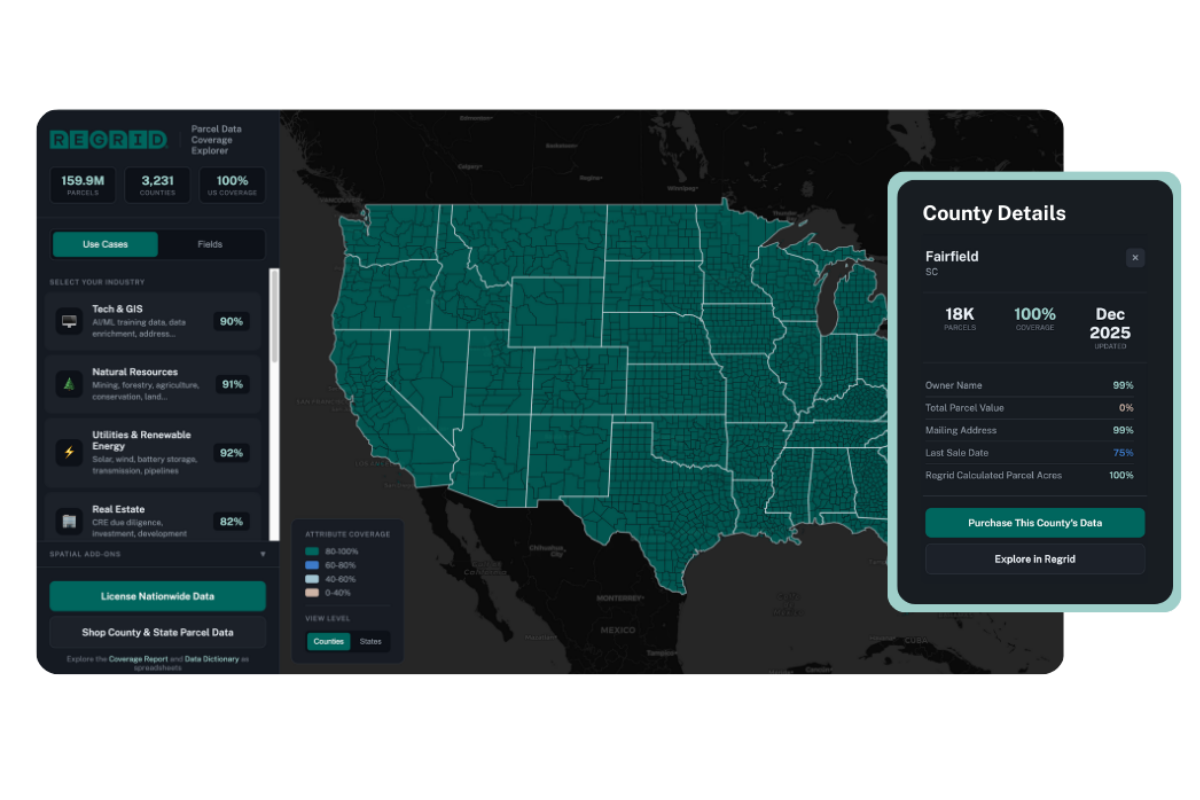
Regrid publishes field-level fill rates at the county level so users can evaluate individual attributes by geography rather than relying only on a headline coverage claim.
A good coverage evaluation starts with asking:
-
-
- Which fields are essential for your use case?
- How well are those fields populated in the counties or states you need?
- Are gaps concentrated in particular places?
- Could those gaps reflect local collection practices or disclosure restrictions?
- Would those gaps materially affect what you are trying to do?
-
Importantly, a low fill rate for a particular attribute does not, by itself, indicate poor-quality data. It may reflect what the local source collects, maintains or is legally permitted to disclose.
Field count alone is not a useful measure of coverage. What matters is whether the specific information your workflow depends on is available in the places you need it.
🔗 Learn more: Why does parcel-data coverage vary, and what should buyers look for?
Customer example: How Bloom Spatial uses Regrid parcel data across co-op service territories
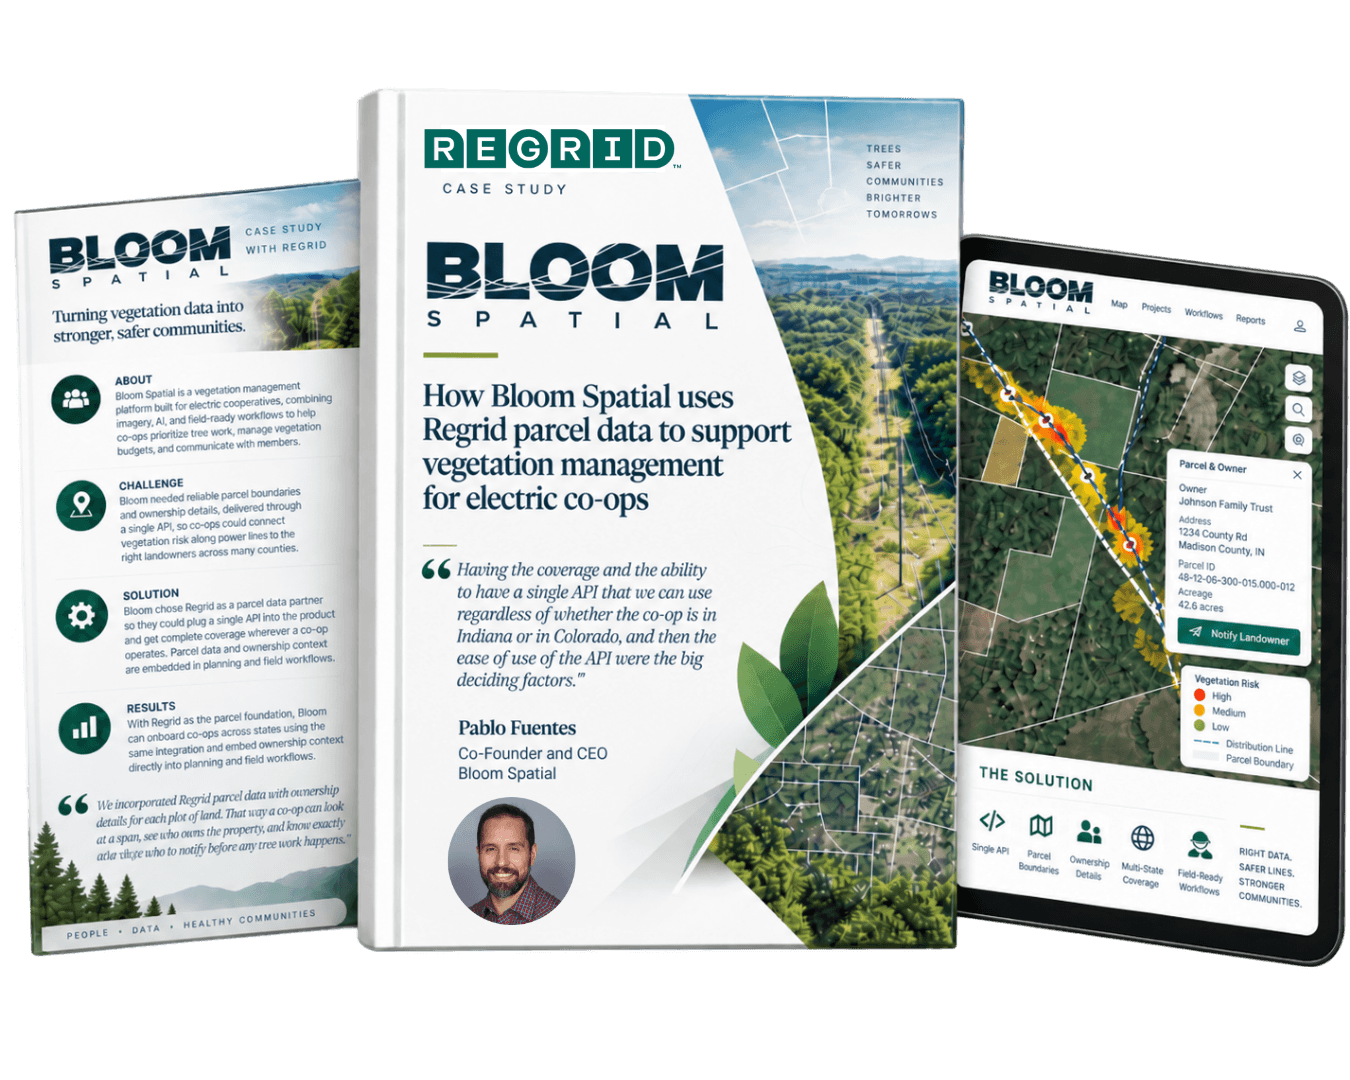
For Bloom Spatial, broad coverage was an operational requirement rather than a headline number. The company needed one parcel-data integration that could support electric co-ops in different counties and states. Bloom identified Regrid's combined geographic and attribute coverage along with the ability to use the same API across markets as important factors in its decision.
Explore the Regrid coverage map
See live coverage, refresh dates, and attribute completeness. Click any county to see parcel counts and field-by-field coverage, then continue to purchase or explore data in the Regrid web app.
In practical terms, completeness tells you whether the fields your workflow depends on are populated often enough to be useful in the places you need them. A high fill rate is not automatically good, and a low fill rate is not automatically bad — both need context.
A field appearing in a schema does not mean it is populated for every parcel.
Completeness asks how frequently the information you need is actually present.
Regrid exposes field-level fill rates and documents limitations associated with individual fields. Ownership is a useful example: an owner field may exist in the schema while availability still varies by jurisdiction or parcel type.
When evaluating completeness:
-
-
- identify the fields your workflow truly depends on;
- check their fill rates in your target geography;
- understand why values may not be present; and
- decide whether that level of completeness is sufficient for the work you intend to do.
-
Completeness is not the same as accuracy
A fill rate tells you how often a field is populated.
It does not tell you that every populated value is correct, current, meaningful or suitable for your use case.
Both high and low fill rates can be misleading without context.
For example, in a rural area with many parcels that do not contain a structure, structure-related fields may naturally have a low fill rate. That does not necessarily indicate poor data quality — the information may simply not apply to many parcels.
The opposite can also happen. If a local jurisdiction uses sentinel values or meaningless placeholders instead of leaving a field blank, the fill rate may appear high even though some of the populated values are not useful.
That is why completeness needs to be assessed alongside the meaning of the field, the characteristics of the geography, the source, currency, methodology and representative data.
Ownership deserves particular scrutiny because “parcel ownership data” is not one universal field and, in some cases, involves circumstances that require special handling.
Regrid's schema contains several ownership-related fields with different purposes. These include its primary owner field, source-preserving owner information, locally supplied ownership classifications and standardized ownership classifications. Regrid also offers Enhanced Ownership as a separate matched dataset.
The practical buyer question is therefore not simply:
Does this provider have ownership data?
Ask instead:
-
-
- Which ownership information do we actually need?
- Where did it come from?
- How current is it?
- How well is it populated in the places we care about?
- Has it been standardized, preserved from the source, or both?
- Would an additional ownership-specific dataset be relevant to our workflow?
-
Ownership information can look straightforward, but the underlying source data is not always structured in a way that supports simple interpretation.
For example, local government sources do not always separate first and last names into distinct fields. If a source provides a name such as “Harriet James” as a single value, it may not be possible to determine reliably which element is the first name and which is the last without making assumptions that are not supported by the source.
That is an important evaluation point: a provider should be clear about where ownership information comes from, what has been preserved from the source, and where additional processing or standardization has taken place.
Currency also matters. Standard parcel ownership information is typically tied to parcel or assessment records, while recording transactions can reflect ownership changes before parcel or assessment records are updated.
For users in need of more frequent ownership updates, Regrid's Enhanced Ownership dataset tracks recording transactions with daily data deploys rather than relying only on less frequently published parcel or assessment records. Recorded transactions almost always reflect the first official ‘indicator’ of a change of ownership and as such present the best source of the ‘most current’ ownership data. This provided an enhanced view of ownership currency for workflows where recent changes matter.
This distinction becomes especially important when comparing providers that may use the phrase “ownership data” to describe quite different source records, update processes and levels of standardization.
🔗 Learn more: How should you evaluate parcel ownership data?
Provenance helps you understand the origin of a value and what happened to it before it reached you.
A buyer should be able to distinguish between:
-
-
- information supplied by an authoritative source;
- information that has been standardized;
- information calculated or created by the provider; and
- information matched from another dataset.
-
Those distinctions matter when comparing providers because the same-looking value may represent an authoritative source record, a provider-created standardization, a derived value or the result of a match to another dataset.
Regrid's schema documents the source of each field and its standardization status, helping users understand where individual data elements came from and how they have been handled.
This matters because two similar-looking fields can serve different purposes.
A locally sourced field may preserve jurisdiction-specific meaning. A standardized field may make analysis across many jurisdictions easier. A matched field may originate in a separate dataset that has been linked to the parcel.
Neither local nor standardized information is automatically better. What matters is understanding which field you are using, where it came from, what has happened to it, and whether it is appropriate for your workflow.
Regrid places particular importance on maintaining this source context because understanding the provenance of different data elements is essential to interpreting them correctly and making sound decisions from the data.
Parcel data originates in thousands of local systems that were not designed around one national schema.
A nationwide provider therefore has to make decisions about:
-
-
- which local fields can be mapped into a common structure;
- which values can usefully be standardized;
- which source information should be preserved; and
- how those decisions are documented for users.
-
Regrid assembles parcel information into a common schema while preserving source values where appropriate and creating standardized fields for specific purposes. In most cases, even when we standardize a field, we retain the original source data alongside the standardized version. For example, gisacres preserves the source acreage value while ll_gisacres provides a standardized Regrid-derived acreage field. Similarly, the source zoning value is retained alongside the standardized zoning_typeand zoning_subtype fields. This gives users the benefit of a consistent schema without losing the underlying local context.
For buyers, the important questions are:
-
-
- Are field names and definitions consistent?
- Can I tell where a field came from?
- Is it clear which values have been standardized?
- Are source values retained where they remain useful?
- Does the documentation explain when a field should and should not be used?
-
A good schema should do more than make data technically tidy.
It should help you understand what the information means and provide insight to users on its reliability for different use cases.
Customer example: See how Burns & McDonnell standardized parcel data across the enterprise
Burns & McDonnell evaluated multiple parcel-data providers with a focus on coverage, accessibility and legal risk. They chose Regrid for nationwide coverage, consistent formatting, regular updates, flexible delivery options and alignment with its Esri environment. Standardizing on one parcel layer has helped the firm create more consistent workflows across its divisions.

Parcel boundaries need to be evaluated differently from ordinary attributes.
Evaluating parcel-boundary quality therefore means looking at source, validation, spatial context and intended use — not simply whether the lines appear to match an aerial image.
A buyer should understand where the geometry originated, what validation has taken place and what the provider does when spatial problems appear.
Regrid relies on authoritative parcel sources and documents several parts of its geometry-processing methodology, including checks for county completeness, correction of common polygon problems and handling of larger spatial issues.
Regrid also does not simply move parcel boundaries to match aerial imagery or another basemap. Imagery itself can contain spatial inaccuracies, and aligning parcel geometry visually to a particular image does not necessarily make it more accurate.
When comparing providers, ask:
-
-
- Who created or maintains the underlying parcel geometry?
- What validation is performed?
- How are invalid geometries handled?
- What happens when a larger spatial problem is identified?
- Does the provider alter authoritative parcel lines to match imagery or another basemap?
- Is the level of precision appropriate for what we need to do?
-
It can be tempting to judge parcel geometry visually by comparing it with aerial imagery. However, the fact that a parcel line does not appear to align perfectly with an image does not, by itself, tell you which dataset is wrong.
Most parcel geometry originates with local sources. Those sources may have access to different levels of positional precision and different imagery for georeferencing their parcels. That imagery is not always mapping-grade orthorectified imagery, which means spatial error can sometimes be introduced at the source.
The imagery used later to view or evaluate those parcels can also contain positional error. In those cases, an apparent misalignment may be caused partly or entirely by the imagery rather than the parcel geometry.
This matters because people naturally tend to trust what they see in an image. A visual overlay can be useful for identifying something worth investigating, but it should not be treated as proof that the parcel boundary is incorrect.
It’s very important to remember that parcel data is not survey-quality data and no GIS parcel data should be treated as a substitute or replacement for a professional survey.
While useful for mapping, analysis, property research and understanding the spatial relationship between parcels it should not be relied on for legal boundary decisions, final placement of people or personal property on a parcel, or property conveyance.
Where the exact legal location of a boundary matters, the appropriate next step is to have the property surveyed.
🔗 Learn more: How should you evaluate parcel boundary quality?
Compliance is one of Regrid’s four Cs alongside currency, coverage and completeness.
For Regrid, compliance means operating in accordance with the applicable laws, statutes and ordinances governing property and public-record data in every jurisdiction where we operate. At our core, Regrid believes responsible data practices are part of delivering a reliable product.
Clear provenance & scope
Regrid assembles its core U.S. parcel dataset from over 3,000 government sources within the United States. Our dataset is fundamentally about land and property, not individual behavior. The vast majority of our attributes describe parcels, land, buildings, zoning, assessments, geography, infrastructure, or environmental characteristics rather than people.
Active monitoring & adaptation
Because privacy laws change frequently, compliance at Regrid is an ongoing process. We work with experienced privacy counsel to monitor existing, proposed, and newly enacted local, state, federal, and national requirements, and adapt our data products and processes accordingly.
-
-
- Protection & suppression: Regrid maintains a robust redaction and suppression process for qualifying requests. When an applicable request is validated, we remove the protected owner information and maintain the suppression so it is not later restored through routine source updates.
- Privacy-first product design: Compliance requirements directly influence our product scoping. For example, Regrid’s European parcel-data offering was designed with an GDPR-aware, compliance-first scope: it focuses primarily on parcel geometry, includes addresses only where permissible, and keeps personal information and valuation data entirely out of scope.
-
A trusted data partner for our customers Regrid aims to be a trusted data partner, not merely a data supplier. A provider that actively monitors changing requirements helps reduce the risk of customers relying on data that should not be collected, disclosed, or distributed. Our privacy program includes the review of data uses and contractual protections designed to reduce the risk of inappropriate downstream use, and we work directly with customers to explain the provenance, context, and limitations of particular fields.
When evaluating a parcel-data provider, ask:
-
-
- What is your process for handling redaction requests?
- How do you monitor changes to local, state, federal or national laws affecting public-record data?
- How are newly enacted requirements incorporated into your products and processes?
-
-
-
- Do compliance requirements affect which attributes are available in particular jurisdictions?
-
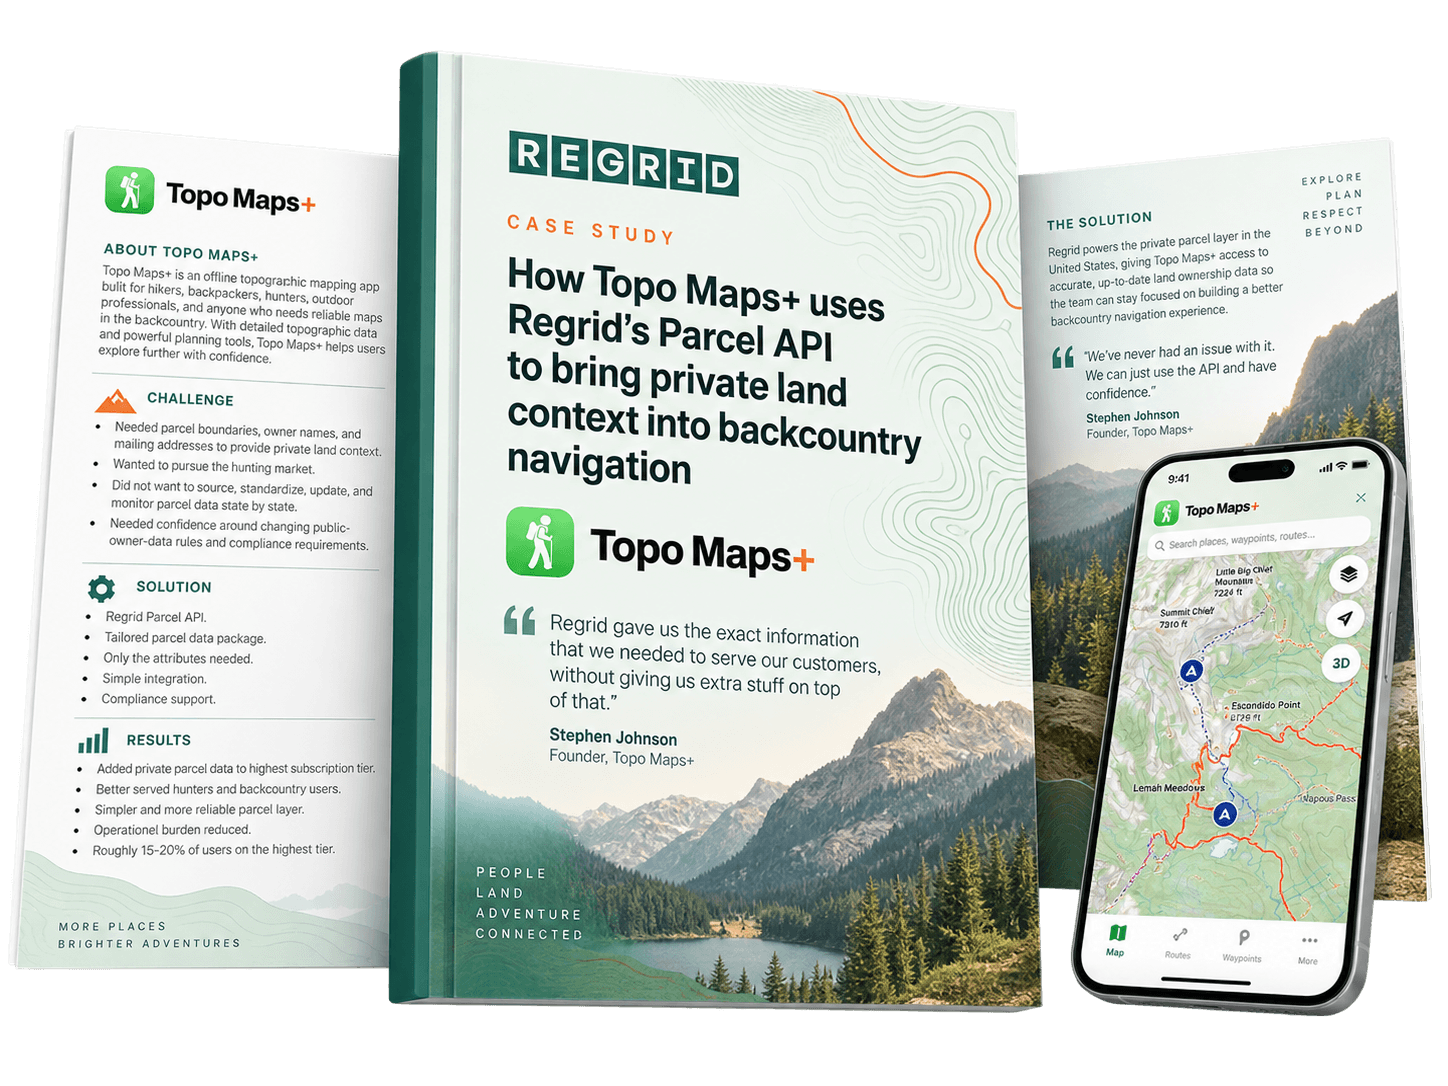
Customer example: See how Topo Maps+ uses Regrid parcel data while managing changing public-record requirements
Topo Maps+, for example, wanted a parcel-data provider that would stay on top of changing state-level rules around public owner information and redactions rather than requiring its own team to monitor those changes. Regrid's handling of those requirements allows the Topo Maps+ team to keep using the parcel API without taking on that regulatory monitoring workload itself.
A provider can tell you its data is current, comprehensive or high quality.
A stronger evaluation asks whether you can inspect the evidence behind those claims.
Regrid makes several evaluation resources available, including:
-
-
- parcel schema documentation;
- field-level coverage information;
- geography-level refresh information;
-
-
-
- data-processing methodology; and
- sample parcel data within areas of your choosing.
-
These resources are most useful when considered together.
A strong evaluation should let you connect a provider's claims to evidence. For example, you should be able to test a coverage claim against field-level coverage, a currency claim against refresh and attribute dates, and a schema claim against documented field definitions and representative records.
Check the schema
Identify the fields your workflow requires and understand what they mean, where they come from and how they should be used.
Customer example: Read how Autodesk integrated Regrid parcel data into Forma
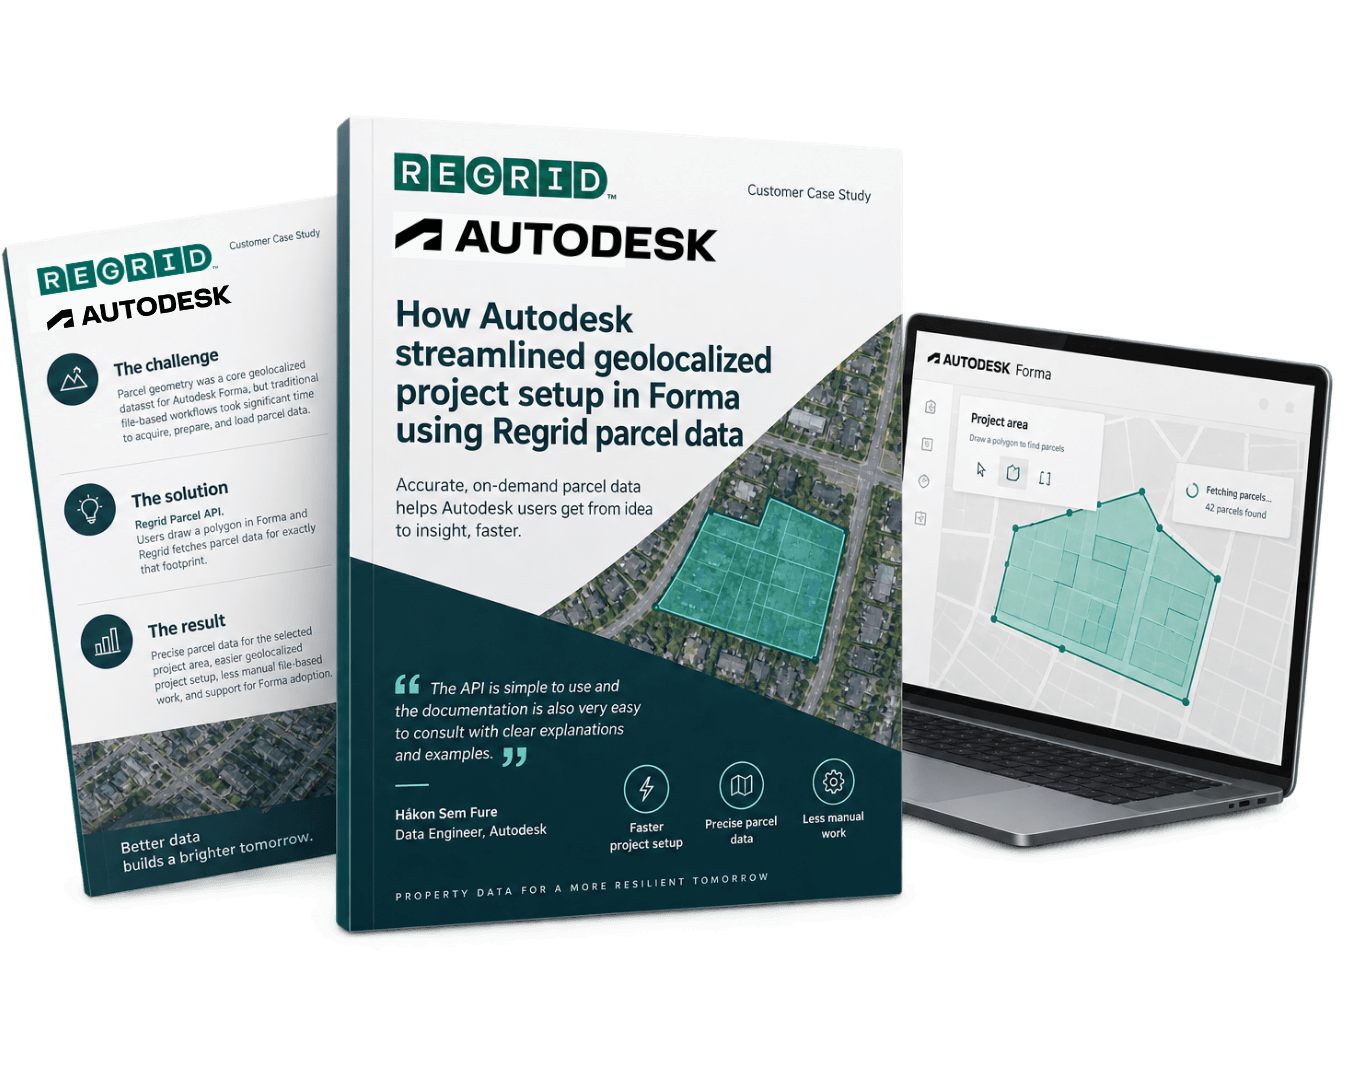
When Autodesk integrated Regrid into Forma, its data team highlighted the API documentation as easy to consult, with clear explanations and examples. That straightforward documentation helped the team adopt the API quickly and reliably.
Check coverage and currency
Look at actual field coverage and refresh information in the locations you need rather than relying only on nationwide headline figures.
Inspect sample data
Review representative records and confirm that the structure and relevant values fit the way you intend to use the data.
At Regrid, there are two ways to do this.
For an Enterprise evaluation, start with the way you expect to use the data. Regrid's team can provide evaluation data through the delivery method that makes sense for your workflow — whether that's bulk files, Feature Service, API or another option. That way, you can test not just the data itself, but how well it fits into the tools, systems and processes your team already uses.
🔗 Learn more about Regrid's data delivery methods
If you want to explore the data on your own first, Regrid also provides downloadable samples through the Data Store. The sample datasets cover full counties and are available in a range of formats, including CSV, FileGDB, GeoJSON, GeoPackage, Parquet and Shapefile, with SQL available for some samples. They include the Regrid Premium Schema, so you can get a feel for the fields, structure and standardized parcel information before taking the next step.
You can also download a small sample directly from individual county pages in the Data Store. These include 20 parcel records, with the full set of information Regrid has for each parcel, making them a quick way to inspect the data in a geography you care about.
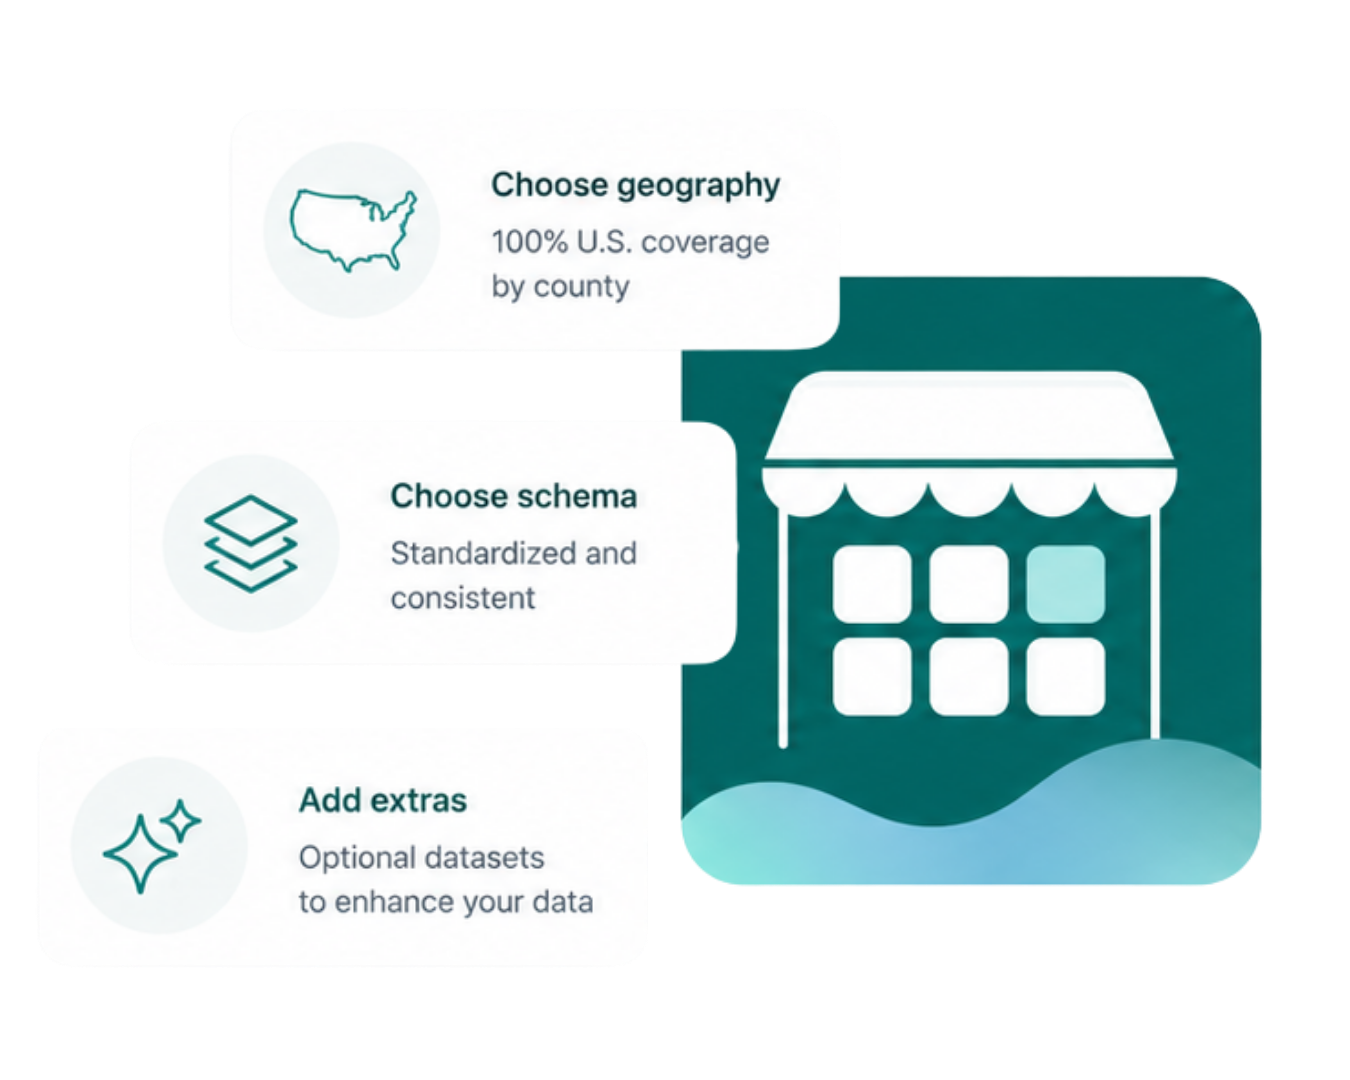
Before choosing a provider, define the geographies, fields and workflows you need to support.
Then evaluate the provider across the following areas.
✅ Currency
-
-
- How current is the data in the places we need?
- What does the reported refresh date actually represent?
- Are important related or matched datasets refreshed on separate schedules?
-
✅ Coverage and completeness
-
-
- Are our critical fields populated where we need them?
- Are any gaps concentrated in important markets?
- Do we understand why those gaps exist?
- Would they materially affect our workflow?
-
✅ Provenance
-
-
- Can we tell what is sourced, standardized, calculated or matched?
- Can we trace important fields back to their source and understand how they have been handled?
-
✅ Schema and standardization
-
-
- Is the schema clearly documented?
- Can we understand what each field means and when to use it?
- Are local/source values and standardized values clearly distinguished?
- Are source values preserved where that context remains useful?
-
✅ Geometry
-
-
- Where do the parcel boundaries come from?
- What validation takes place?
- How are spatial-quality issues handled?
- Does the provider alter authoritative geometry simply to align it visually with imagery or another basemap?
- Is the geometry appropriate for the level of precision our workflow requires?
-
✅ Accuracy
-
-
- What does any quality or accuracy claim actually measure?
- Are we accidentally treating completeness as accuracy?
- Can we inspect representative data ourselves rather than relying only on headline claims?
-
✅ Compliance
-
-
- What is your documented process for handling redaction requests or requirements?
- What steps do you take to monitor changes in applicable laws, statutes and ordinances?
- How are new requirements incorporated into your data products and processes?
- What is your process for obtaining permission from local sources where required?
-
✅ Transparency
-
-
- Can we inspect field-level coverage and refresh information?
- Can we review the schema, sources and methodology?
- Can we look at representative data before committing?
- Can the provider clearly explain known limitations relevant to our use case?
-
✅ Fit for your workflow
-
-
- Can the data be delivered in the way our systems need to consume it?
- Can we test it in the same type of workflow we expect to use in production?
- Are the provider's documentation and support sufficient for our implementation needs?
-
Parcel-data quality is ultimately about whether a dataset is fit for the work you need it to do. Currency, coverage, completeness, provenance, standardization, geometry and compliance all contribute to that assessment, but their importance will vary depending on your geography, workflow and technical requirements.
The strongest evaluation starts with those requirements and then tests each provider against them using documentation, coverage information, methodology, representative data and evidence of how the data performs in real customer workflows. That gives you a clearer basis for comparing providers and understanding where any limitations are likely to matter in practice.
Ready to compare providers? See the 10 key questions to ask before choosing a parcel-data provider 🔗
Smarter location decisions start here
-
Parcel-data quality cannot be judged from parcel count or field count alone. Consider currency, geographic and attribute coverage, completeness, provenance, standardization, geometry, compliance and whether the provider gives you enough evidence to determine whether the data is fit for your workflow.
-
No. Parcel-boundary coverage and attribute coverage are different. Individual fields can have different levels of coverage across jurisdictions.
🔗 Learn more: Why does parcel-data coverage vary, and what should buyers look for?
-
Look at the provider’s refresh information for the geography you need, but also check time-related attributes within the data, such as tax year or transaction dates. Different elements of a parcel record — and separate matched datasets — can have different update schedules.
-
Check where the ownership information comes from, how well it is populated, how the source structures owner names, whether values have been standardized or processed, and how quickly the underlying source reflects ownership changes. Different ownership datasets may serve different needs.
🔗 Learn more: How should you evaluate parcel ownership data?
-
Look at the source of the geometry, the provider’s validation and processing methodology, how spatial problems are handled and whether the geometry is appropriate for your required level of precision. Do not judge parcel boundaries from aerial-image alignment alone: both the parcel geometry and the imagery can contain positional error.
🔗 Learn more: How should you evaluate parcel boundary quality?
-
Ask how the provider handles redaction requirements, monitors changes to applicable laws and regulations, incorporates new requirements into its products, and obtains permission from local sources where required. Compliance requirements can also affect which data attributes are available in particular jurisdictions.


















(888) 4RE-GRID
Subscribe for email updates