
-
Products ⌄
 Premium parcels
.png) AI and ML tools
AI and ML tools
 Roadway ROW
 Spatial add-ons
 Delivery methods
- Industries ⌄
- Data store
- Property App
- Esri users
-
Resources ⌄
 Content
 Programs
.png) Shop
Shop
- Contact us







.svg)

.png)






















-
Products ⌄
AI and ML tools
Roadway ROW
-
Industries ⌄
-
Resources ⌄
PARCEL DATA QUALITY
Why does parcel-data coverage vary,
and what should buyers look for
Jump straight to:
Geographic coverage and attribute coverage are different
Why does attribute coverage vary?
A low fill rate does not automatically mean poor-quality data
Evaluate the fields that matter to your workflow
Use coverage information at the right geographic level
How Regrid exposes parcel-data coverage
Understanding parcel-data coverage
Parcel-data coverage is easy to misunderstand.
A provider may offer parcel boundaries across a large geography while individual attributes — such as owner names, mailing addresses or land-use classifications — vary significantly from one jurisdiction to another.
That does not automatically mean the data is poor quality.
Much of that variation reflects how local property records are created, maintained and disclosed.
For teams evaluating parcel data across multiple counties, states or markets, that distinction matters because broad geographic coverage does not guarantee that every field your workflow depends on will be equally available in every location.
Key takeaway: A useful coverage evaluation separates two questions:
➡️ Geographic coverage: Are parcel records and boundaries available where you need them?
➡️ Attribute coverage: Are the specific fields you depend on populated often enough in those places?
Low fill rates can reflect local collection practices, disclosure restrictions or legal requirements rather than a failure by the data provider.
A useful coverage evaluation focuses on whether the attributes your workflow depends on are available in the places that matter, and whether you understand the reasons behind any gaps.
A dataset can have strong parcel-boundary coverage across a county, state or nationwide footprint while individual fields vary considerably.
For example, one jurisdiction may provide owner names, mailing addresses and detailed land-use information consistently.
Another may provide fewer attributes.
So a headline claim about geographic coverage does not tell you how complete every field will be.
When evaluating a provider, look at both:
1. Where parcel records and boundaries are available, and2. How well the specific attributes you need are populated within those places.
One of the biggest reasons is local control.
Local authorities maintain property information according to their own administrative needs and priorities. Different jurisdictions may choose to collect different attributes, maintain them in different ways or make different information available publicly.
Local and state law can also affect coverage.
In some places, authorities may not be permitted to collect or disseminate certain information. It is also becoming more common for jurisdictions and states to require particular information to be redacted from public records.
That means a missing attribute may reflect:
-
-
- that the local source does not collect it;
- that the local source does not maintain it consistently;
- that the information is not publicly available; or
- that disclosure is restricted by local or state law.
-
These causes can look identical in a coverage percentage — the field is simply unpopulated — but they have very different implications for how a buyer should interpret the gap.
This is one of the most important points for buyers to understand.
A field can have a low fill rate because the authoritative source does not provide that information broadly.
In that case, a lower fill rate may accurately reflect the available public record.
So fill rate should not be treated as a standalone quality score.
Instead, ask:
-
-
- Why is the field missing?
- Is the limitation source-driven or provider-driven?
- Is the gap concentrated in certain jurisdictions?
- Does the gap affect the geographies or workflows that matter to us?
- Is there another field or dataset better suited to the task?
-
A high fill rate can be useful.
But without understanding how the field was sourced and what the value represents, the percentage alone does not tell you whether the data is appropriate for your use case.
The reverse can also be true. A high fill rate may look reassuring while still overstating how much useful information is present if a source uses sentinel values or other placeholder values instead of leaving fields blank. Coverage percentages therefore need to be interpreted alongside the meaning of the values themselves.
Most buyers do not need every available parcel attribute.
They need a smaller set of fields to work reliably across the places they care about.
Start by identifying those critical attributes.
Then ask:
-
-
- Is the field available in the counties or states we need?
- What is the fill rate in those geographies?
- Are gaps concentrated in particular places?
- Do local collection or disclosure rules explain those gaps?
- Would missing values materially affect the decision or workflow?
-
This makes coverage a practical fit test: do the fields you rely on have enough usable coverage in the places your workflow actually operates?
Nationwide averages can hide local differences.
If your workflow depends on a particular set of counties, states or markets, evaluate coverage in those places specifically.
Regrid publishes field-level coverage information at the county level so users can see how individual attributes are populated by geography rather than relying only on a nationwide claim.
That makes it possible to compare the fields that matter against the locations that matter.
Customer example: How Bloom Spatial uses Regrid parcel data across co-op service territories
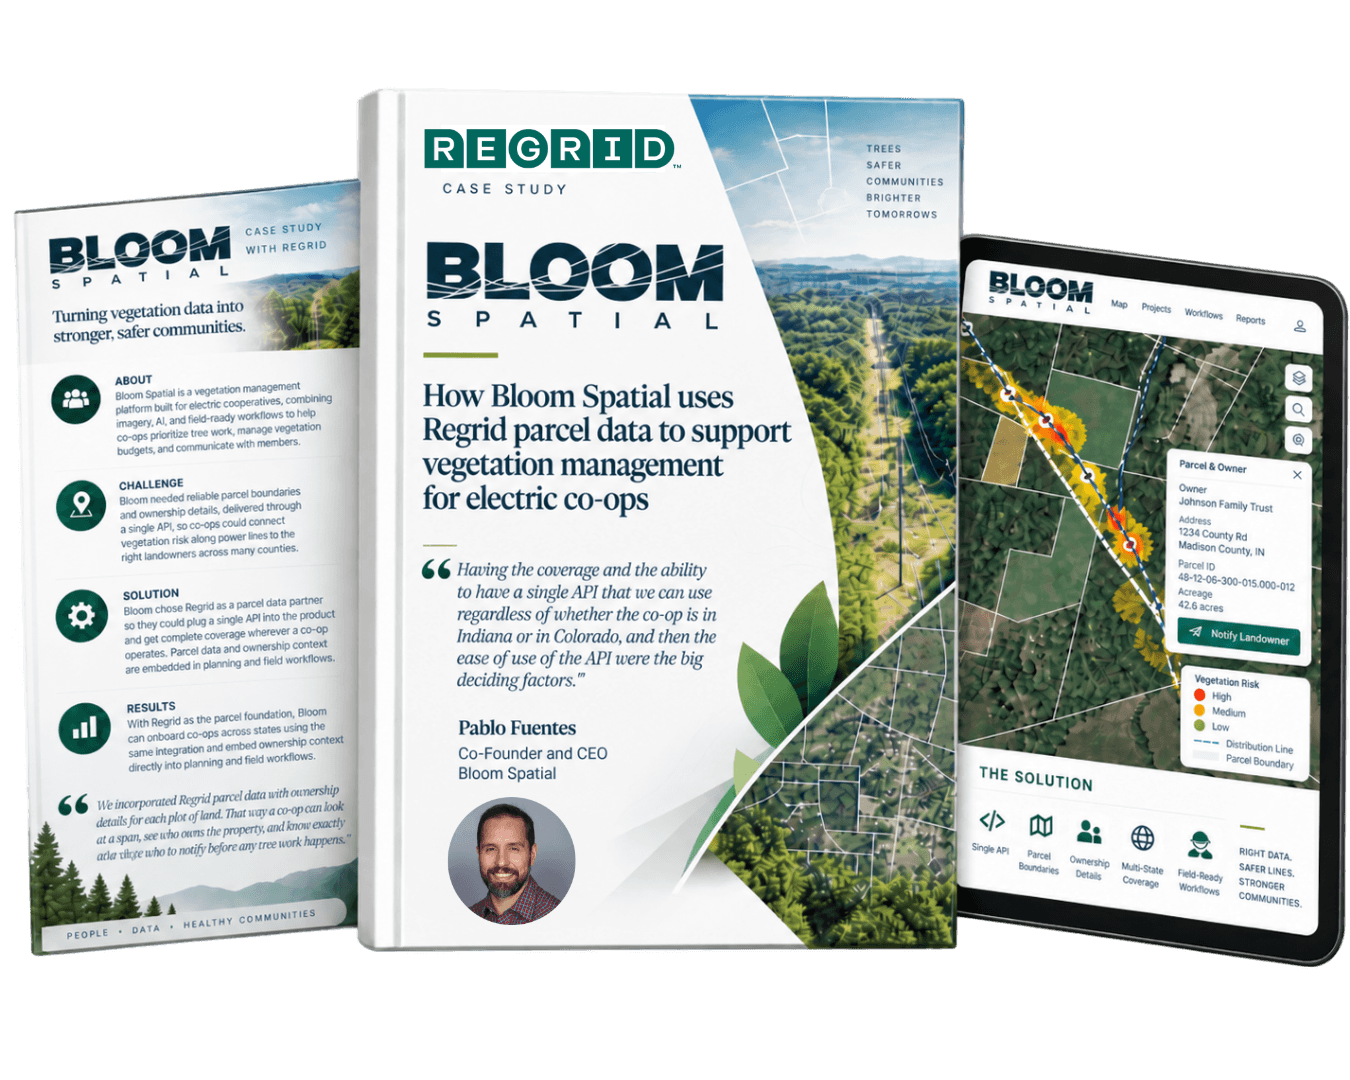
Bloom Spatial needed parcel data that could support electric co-ops operating in different counties and states without requiring a new data integration for every market. Bloom identified Regrid's broad coverage and the ability to use the same API across geographies as important reasons for choosing Regrid.
Regrid distinguishes between parcel coverage and field-level coverage. Its coverage resources let you inspect individual attributes at the county level, so you can compare the fields your workflow depends on against the specific geographies you need to support.
This makes coverage differences visible rather than hiding them behind a nationwide average, giving buyers a clearer basis for deciding whether the available data is sufficient for their use case.
🔗 Related: How to evaluate parcel data quality: A buyer’s guide
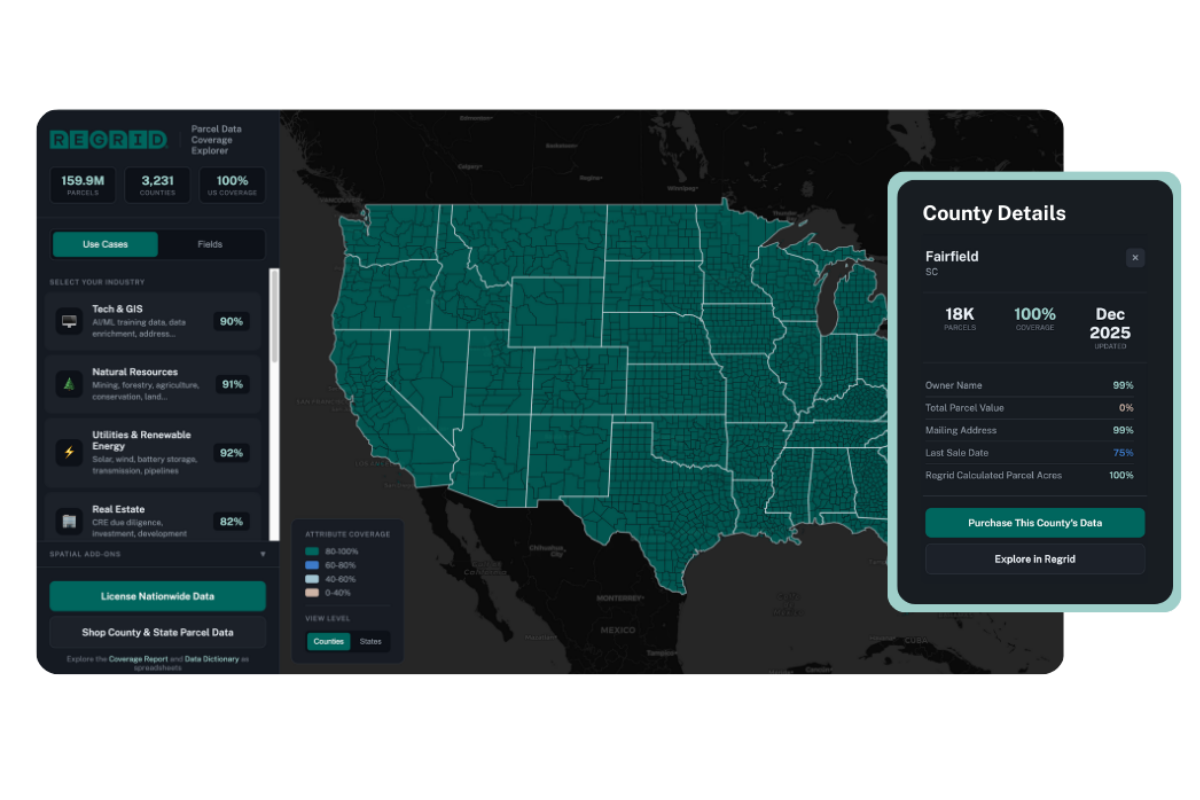
Inspect Regrid's coverage directly: see parcel coverage, refresh dates and field-level completeness by county.
Click any county to see parcel counts and field-by-field coverage, then continue to purchase or explore data in the Regrid web app.
-
Geographic coverage tells you whether parcel records and boundaries are available in the locations you need. Attribute coverage tells you how often specific fields — such as owner names, mailing addresses or land-use information — are populated within those locations.
-
Parcel data is largely maintained by local authorities, and jurisdictions differ in what they collect, how they maintain it and what they are permitted to make publicly available. Local and state disclosure rules can also affect which attributes appear in public records.
-
Not necessarily. A low fill rate may accurately reflect what the authoritative local source collects or is legally permitted to disclose. Fill rate should therefore be interpreted alongside source, geography and the needs of your workflow.
-
No. A provider can have parcel boundaries across a nationwide footprint while individual attributes vary significantly between jurisdictions.
-
Start with the fields your workflow depends on, then check how well those fields are populated in the counties or states you actually need. Pay particular attention to whether gaps are concentrated in important markets and whether those gaps would materially affect your work.
-
Regrid publishes county-level coverage information for individual parcel attributes so users can evaluate the fields and geographies relevant to their use case.


















(888) 4RE-GRID
Subscribe for email updates